Categories: Technical analysis

WTI Wave Analysis 17 April 2024

– WTI reversed from resistance zone

– Likely to fall to support level 80.00

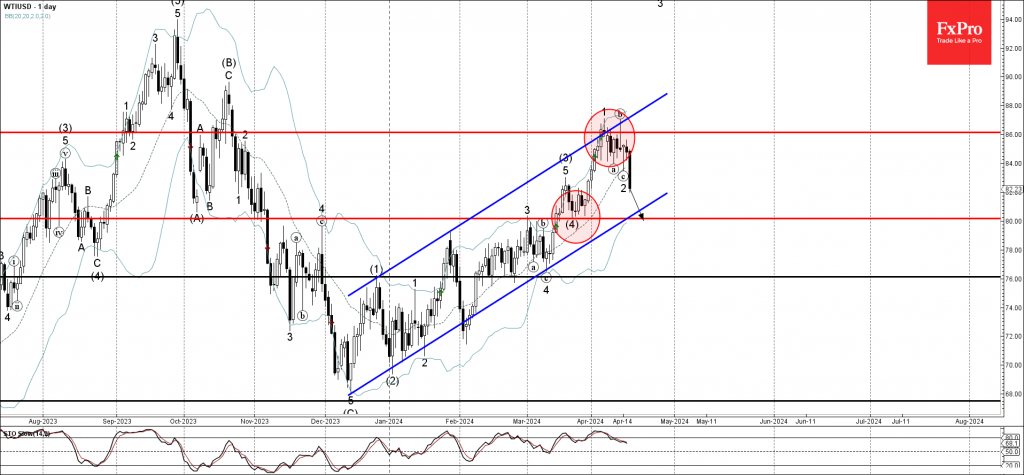
WTI crude oil recently reversed down from the resistance zone lying between the resistance level 86.00, upper daily Bollinger Band and the resistance trendline of the daily up channel from December.

The downward reversal from this resistance zone started the active minor ABC correction 2.

WTI crude oil can be expected to fall further to the next round support level 80.00 (former low of wave (4) from March).

The FxPro Tech Analysis Team

The FxPro technical experts prepare a daily analysis of the most active currency pairs (majors, crosses, exotics) and commodities. Selected instruments are reviewed on daily trends (D1, H4), using the active Elliott Wave setups, Japanese candlesticks, indicators, and support/resistance levels.

Share
Published by
The FxPro Tech Analysis Team
Tags: wti

Recent Posts

Tesla Wave Analysis – 10 March 2025

Tesla: ⬇️ Sell        Tesla falling inside sharp impulse waves 5 and (C) Likely to fall…

9 hours ago

Ebay Wave Analysis – 10 March 2025

Ebay: ⬇️ Sell - Ebay reversed from the resistance area - Likely to fall to…

9 hours ago

S&P 500 Wave Analysis – 10 March 2025

S&P 500: ⬇️ Sell - S&P 500 index broke support zone - Likely to fall…

10 hours ago

GBPCAD Wave Analysis – 10 March 2025

GBPCAD: ⬆️ Buy - GBPCAD rising inside minor impulse wave 3 - Likely to reach…

10 hours ago

Gold traders weighting the next move

Gold may fly to the new heights but there are risks following the stock indices.

12 hours ago

US indices desperately cling to the 200-day MA

S&P500 and Nasdaq100, dipped but found support at their 200-day MA, indicating a possible shift…

14 hours ago

This website uses cookies