Categories: Technical analysis

WTI Wave Analysis 20 November 2023

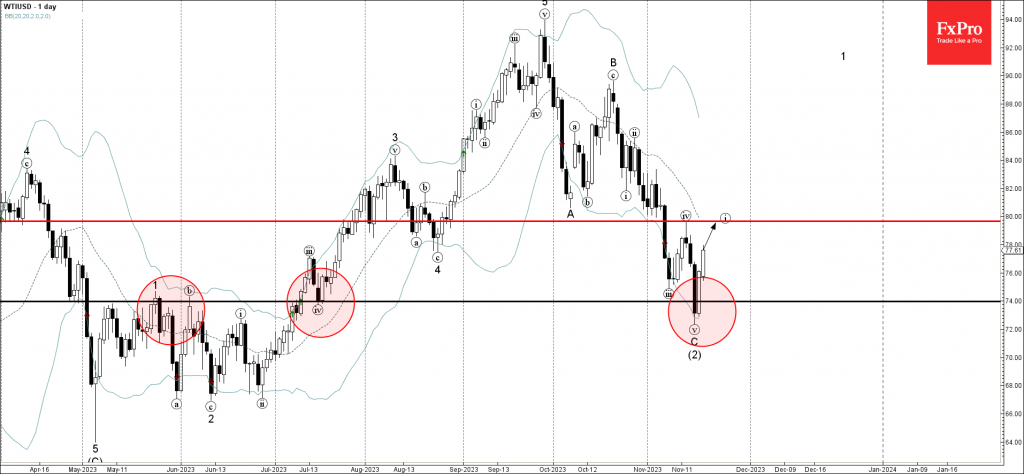
– WTI reversed from pivotal support level 74.00

– Likely to rise to resistance level 80.00

 WTI crude oil recently reversed up from pivotal support level 74.00 (former resistance from May and June) intersecting with the lower daily Bollinger Band.

The upward reversal from the support level 74.00 created the daily Japanese candlesticks reversal pattern Piercing Line, which stopped the previous medium-term ABC correction (2).

Given the strength of the support level 74.00, WTI crude oil can be expected to rise toward the next resistance level 80.00 , the target for the completion of the active impulse wave i, top of the previous correction iv.

The FxPro Tech Analysis Team

The FxPro technical experts prepare a daily analysis of the most active currency pairs (majors, crosses, exotics) and commodities. Selected instruments are reviewed on daily trends (D1, H4), using the active Elliott Wave setups, Japanese candlesticks, indicators, and support/resistance levels.

Share
Published by
The FxPro Tech Analysis Team
Tags: WTIUSD

Recent Posts

EURCAD Wave Analysis 6 September 2024

- EURCAD reversed from pivotal support level 1.4900 - Likely to rise to resistance level…

1 day ago

EURUSD Wave Analysis 6 September 2024

- EURUSD reversed from support level 1.1030 - Likely to rise to resistance level 1.1200…

1 day ago

Further Unwinding of Carry Trade

The unwinding of the carry trade in the FX market continues, with the major safe…

1 day ago

Bitcoin pressured by risk-off mood

Market Picture The pressure on risk assets continues, pushing the crypto market capitalisation back below…

2 days ago

AUDUSD Wave Analysis 5 September 2024

- AUDUSD reversed from support level 0.6700 - Likely to rise to resistance level 0.6800…

2 days ago

Gold Wave Analysis 5 September 2024

- Gold reversed from support level 2475.00 - Likely to rise to resistance level 2535.00…

2 days ago

This website uses cookies