Categories: Technical analysis

WTI Wave Analysis 15 October, 2020

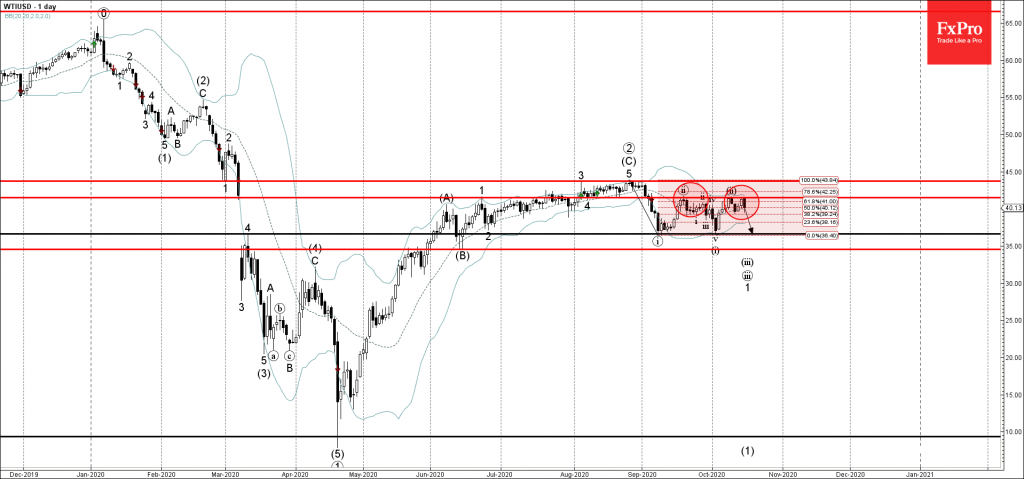
• WTI reversed from key resistance level 41.50

• Likely to fall to 36.60

WTI today once again reversed down from the key resistance level 41.50 (which has been reversing the price from the middle of September).

The resistance area near the resistance level 41.50 was strengthened by the upper daily Bollinger Band and by the 61.8% Fibonacci correction of the downard impulse (i) from August.

WTI is likely to fall further toward the next support level 36.60 (which stopped the previous waves (i) and i, as can be seen below).

The FxPro Tech Analysis Team

The FxPro technical experts prepare a daily analysis of the most active currency pairs (majors, crosses, exotics) and commodities. Selected instruments are reviewed on daily trends (D1, H4), using the active Elliott Wave setups, Japanese candlesticks, indicators, and support/resistance levels.

Share
Published by
The FxPro Tech Analysis Team
Tags: WTIUSD

Recent Posts

Strong macro data and rate spreads are the USD’s main weapon

Strong US macro data and wide rate spreads boost the dollar, pressuring EURUSD and gold;…

1 hour ago

Top 10 Forex Trading Strategies

We have outlined the 10 best forex trading strategies with clear logic, real-world context, and…

3 hours ago

Bitcoin has not crossed the correction line

Bitcoin holds near $95.5K as the market steadies but hasn't confirmed a exit from correction…

3 hours ago

CHFJPY Wave Analysis – 15 January 2026

CHFJPY: ⬇️ Sell - CHFJPY reversed from resistance zone - Likely to fall to support level…

15 hours ago

WTI Crude Oil Wave Analysis – 15 January 2026

WTI Crude Oil: ⬇️ Sell - WTI Crude Oil rising inside minor impulse wave (1) -…

15 hours ago

Costco Wave Analysis – 15 January 2026

Costco: ⬆️ Buy - Costco rising inside minor impulse wave (1) - Likely to reach resistance…

15 hours ago

This website uses cookies