Categories: Technical analysis

WTI Wave Analysis 15 August 2023


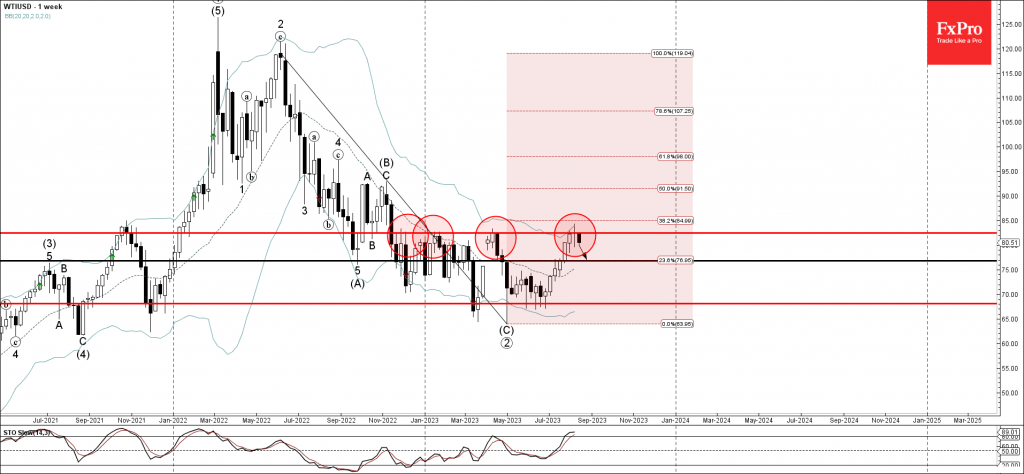
– WTI reversed from resistance level 82.50

– Likely to fall to support level 76.80.

WTI crude oil recently reversed down from the major long-term resistance level 82.50 (which has been reversing the price from the end of last year).

The resistance level 82.50 was strengthened by the upper daily Bollinger Band and the 38.2% Fibonacci correction of the previous downtrend from last year. Given the strength of the resistance level 82.50 and the overbought weekly Stochastic, WTI crude oil can be expected to fall further toward the next support level 76.80

The FxPro Tech Analysis Team

The FxPro technical experts prepare a daily analysis of the most active currency pairs (majors, crosses, exotics) and commodities. Selected instruments are reviewed on daily trends (D1, H4), using the active Elliott Wave setups, Japanese candlesticks, indicators, and support/resistance levels.

Share
Published by
The FxPro Tech Analysis Team
Tags: WTIUSD

Recent Posts

EURCAD Wave Analysis 6 September 2024

- EURCAD reversed from pivotal support level 1.4900 - Likely to rise to resistance level…

1 day ago

EURUSD Wave Analysis 6 September 2024

- EURUSD reversed from support level 1.1030 - Likely to rise to resistance level 1.1200…

1 day ago

Further Unwinding of Carry Trade

The unwinding of the carry trade in the FX market continues, with the major safe…

1 day ago

Bitcoin pressured by risk-off mood

Market Picture The pressure on risk assets continues, pushing the crypto market capitalisation back below…

2 days ago

AUDUSD Wave Analysis 5 September 2024

- AUDUSD reversed from support level 0.6700 - Likely to rise to resistance level 0.6800…

2 days ago

Gold Wave Analysis 5 September 2024

- Gold reversed from support level 2475.00 - Likely to rise to resistance level 2535.00…

2 days ago

This website uses cookies