Categories: Technical analysis

WTI Wave Analysis – 15 April, 2020

  • WTI reversed from support area
  • Likely to rise to 25.00

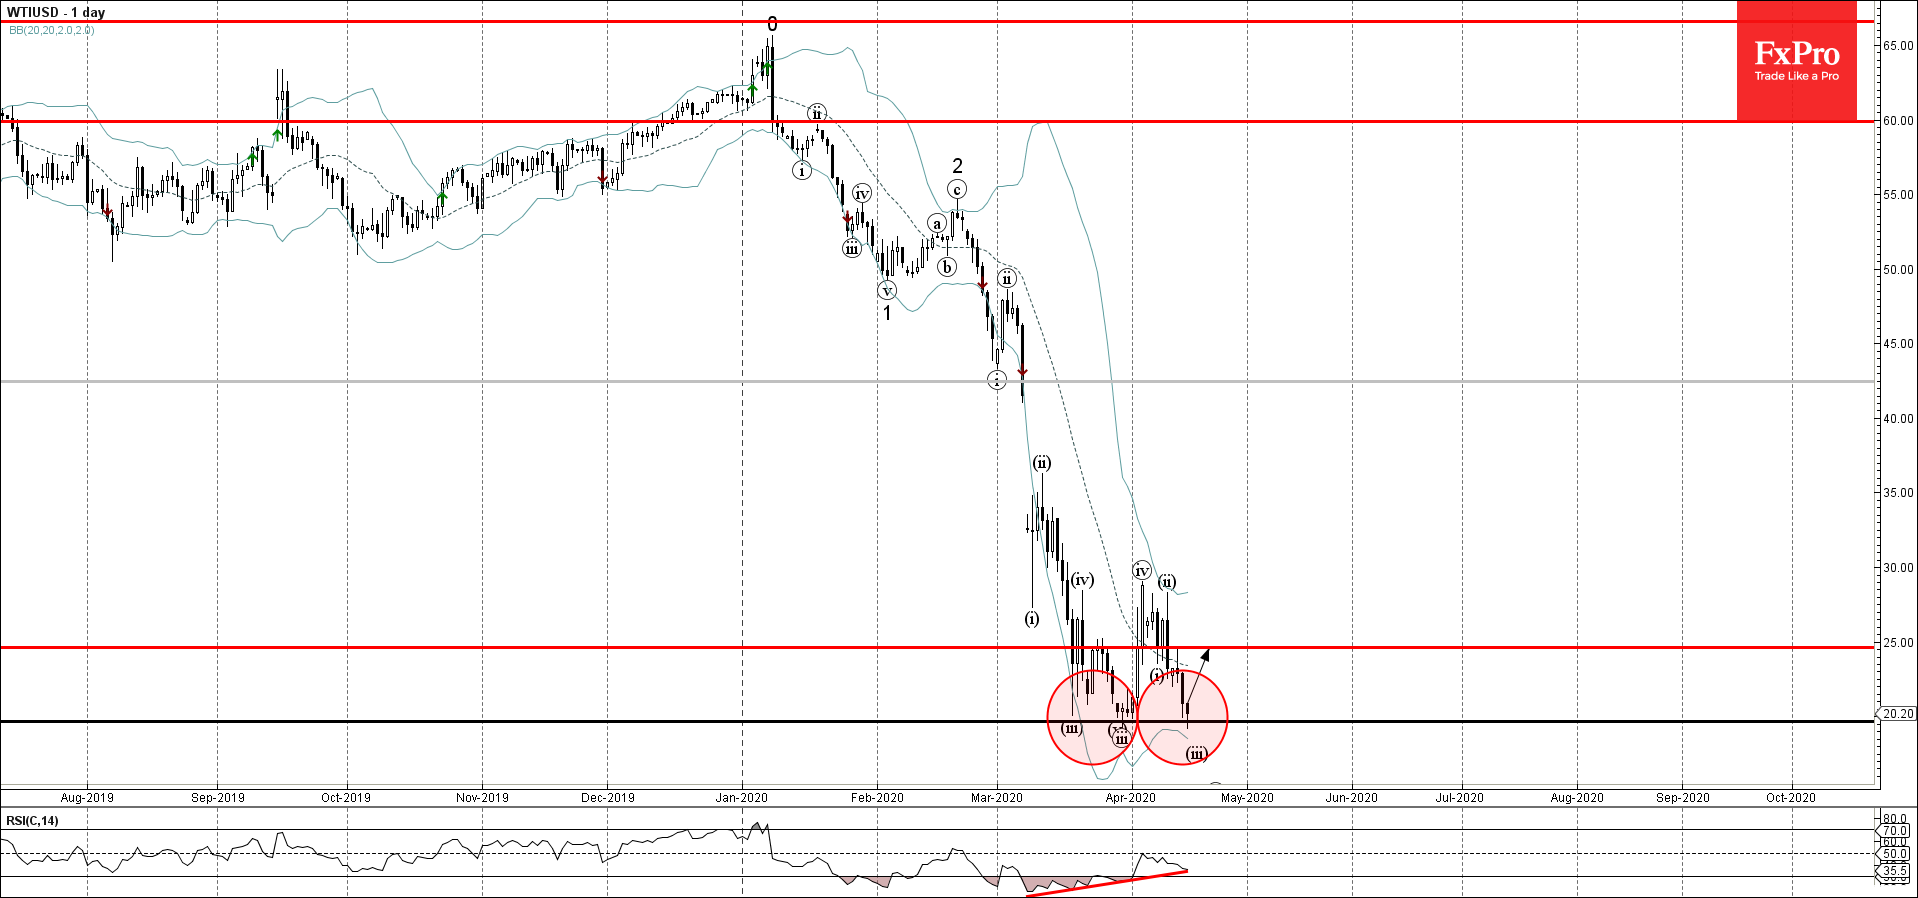
WTI today reversed up from the support area lying between the key support level 19.65 (which stopped the previous impulse waves iii and (iii)) and the lower daily Bollinger Band.

The upward reversal from this support area stopped the previous downward impulse sequence 3 from February.

Given the clear multi-pivot bullish divergence on the daily RSI indicator – WTI is likely to rise further toward the next resistance level 25.00.

The FxPro Tech Analysis Team

The FxPro technical experts prepare a daily analysis of the most active currency pairs (majors, crosses, exotics) and commodities. Selected instruments are reviewed on daily trends (D1, H4), using the active Elliott Wave setups, Japanese candlesticks, indicators, and support/resistance levels.

Share
Published by
The FxPro Tech Analysis Team
Tags: WTIUSD

Recent Posts

USDJPY Wave Analysis 6 May 2024

- USDJPY reversed from support zone - Likely to rise to resistance level 155.65 USDJPY…

4 hours ago

Gold Wave Analysis 6 May 2024

- Gold reversed from support zone - Likely to rise to resistance level 2400.00 Gold…

4 hours ago

Oil Bounces Locally, Global Support 5% below Spot Price

The number of operating oil rigs in the US fell by 7 to 499. This…

8 hours ago

Crypto Market Tries to Break Local Downtrend

Market picture  Crypto market capitalisation has been up 2% over the past seven days and…

14 hours ago

Adobe Wave Analysis 3 May 2024

- Adobe reversed from support zone - Likely to rise to resistance level 500.00 Adobe…

3 days ago

EURGBP Wave Analysis 3 May 2024

- EURGBP reversed from support zone - Likely to rise to resistance level 0.8625 EURGBP…

3 days ago

This website uses cookies