Categories: Technical analysis

WTI Wave Analysis 14 December 2023

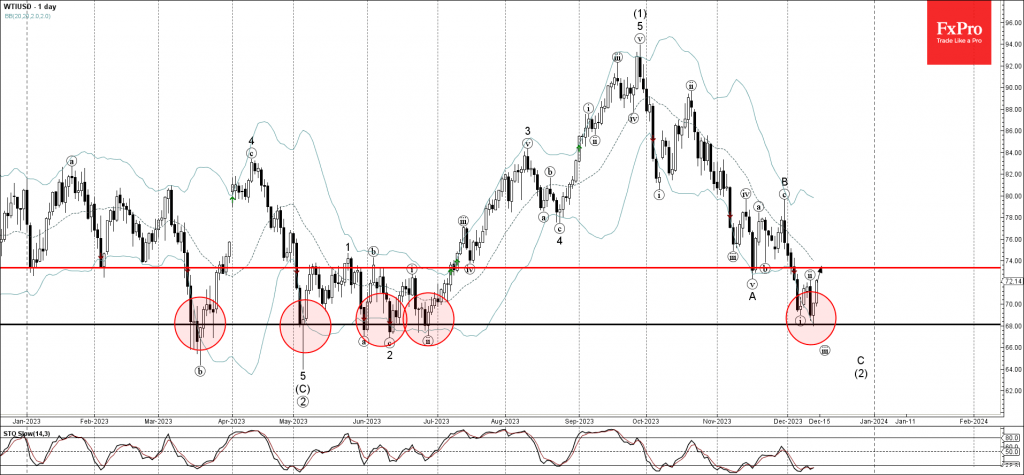
– WTI reversed from support level 68.00

– Likely to rise to resistance level 73.35

WTI crude oil recently reversed up from the major long-term support 68.00 (which has been repeatedly reversing the price from March) coinciding with the lower daily Bollinger Band.

The upward reversal from the support 68.00 is likely to form the daily candlesticks reversal pattern Morning Star – strong buy signal for this instrument.

Given the strength of the support 68.00 and the oversold daily Stochastic, WTI crude oil can be expected to rise to the next resistance level 73.35 (former support from November).

The FxPro Tech Analysis Team

The FxPro technical experts prepare a daily analysis of the most active currency pairs (majors, crosses, exotics) and commodities. Selected instruments are reviewed on daily trends (D1, H4), using the active Elliott Wave setups, Japanese candlesticks, indicators, and support/resistance levels.

Share
Published by
The FxPro Tech Analysis Team
Tags: wti

Recent Posts

ECB, BoE, and BoJ take different paths

Trump pushes for more Fed rate cuts, while no changes are expected from the ECB…

3 hours ago

Crypto Market Holds at $3T Amid Broken Uptrend

Crypto market stays near $3T amid correction, ETF inflows rise, sentiment weakens, and volatility expected…

4 hours ago

Gold Wave Analysis – 12 December 2025

Gold: ⬇️ Sell - Gold reversed from strong resistance level 4350.00 - Likely to fall to…

3 days ago

EURGBP Wave Analysis – 12 December 2025

EURGBP: ⬆️ Buy - EURGBP reversed from support zone - Likely to rise to resistance level…

3 days ago

Filecoin Wave Analysis – 12 December 2025

Filecoin: ⬇️ Sell - Filecoin broke key support level 1.435 - Likely to fall to support…

3 days ago

Ethereum Wave Analysis – 12 December 2025

Ethereum: ⬇️ Sell - Ethereum reversed from resistance level 3400.00 - Likely to fall to support…

3 days ago

This website uses cookies