Categories: Technical analysis

WTI Wave Analysis 12 April, 2021

• WTI rising inside minor impulse wave c

• Likely to reach resistance level 62.00

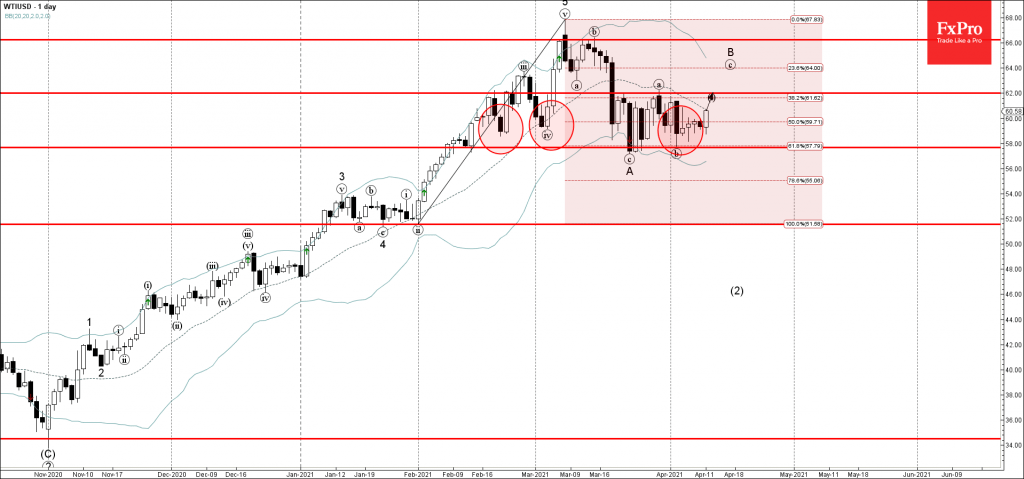
WTI continues to rise inside the minor impulse wave c , which started earlier from the key support level 58.00 (which has been reversing the price from the middle of February).

The active impulse wave c belongs to the minor ABC correction B from the middle of March.

WTI is likely to rise further toward the next resistance level 62.00 (top of the previous short-term corrective wave (a) from last month).

AddThis Website Tools
The FxPro Tech Analysis Team

The FxPro technical experts prepare a daily analysis of the most active currency pairs (majors, crosses, exotics) and commodities. Selected instruments are reviewed on daily trends (D1, H4), using the active Elliott Wave setups, Japanese candlesticks, indicators, and support/resistance levels.

Share
Published by
The FxPro Tech Analysis Team
Tags: wti

Recent Posts

AMD Wave Analysis – 28 March 2025

AMD: ⬇️ Sell - AMD reversed from pivotal resistance level 115.00 - Likely to fall…

2 days ago

Google Wave Analysis – 28 March 2025

Google: ⬇️ Sell - Google broke key support level 160.00 - Likely to fall to…

2 days ago

Gold Wave Analysis – 28 March 2025

Gold: ⬆️ Buy - Gold broke resistance level 3050.00 - Likely to rise to resistance…

2 days ago

Ethereum Wave Analysis – 28 March 2025

Ethereum: ⬇️ Sell - Ethereum reversed from the resistance level 2120.00 - Likely to fall…

2 days ago

US inflation accelerates but lags income growth

US PCE inflation exceeded expectations at 2.8% in February. Income growth and savings rates remain…

2 days ago

What is next: Australia Rate, EU CPI, US NFP

Europe will switch to daylight saving time next week. Key events include the RBA's rate…

2 days ago