- WTI reversed from support zone
- Further gains are likely
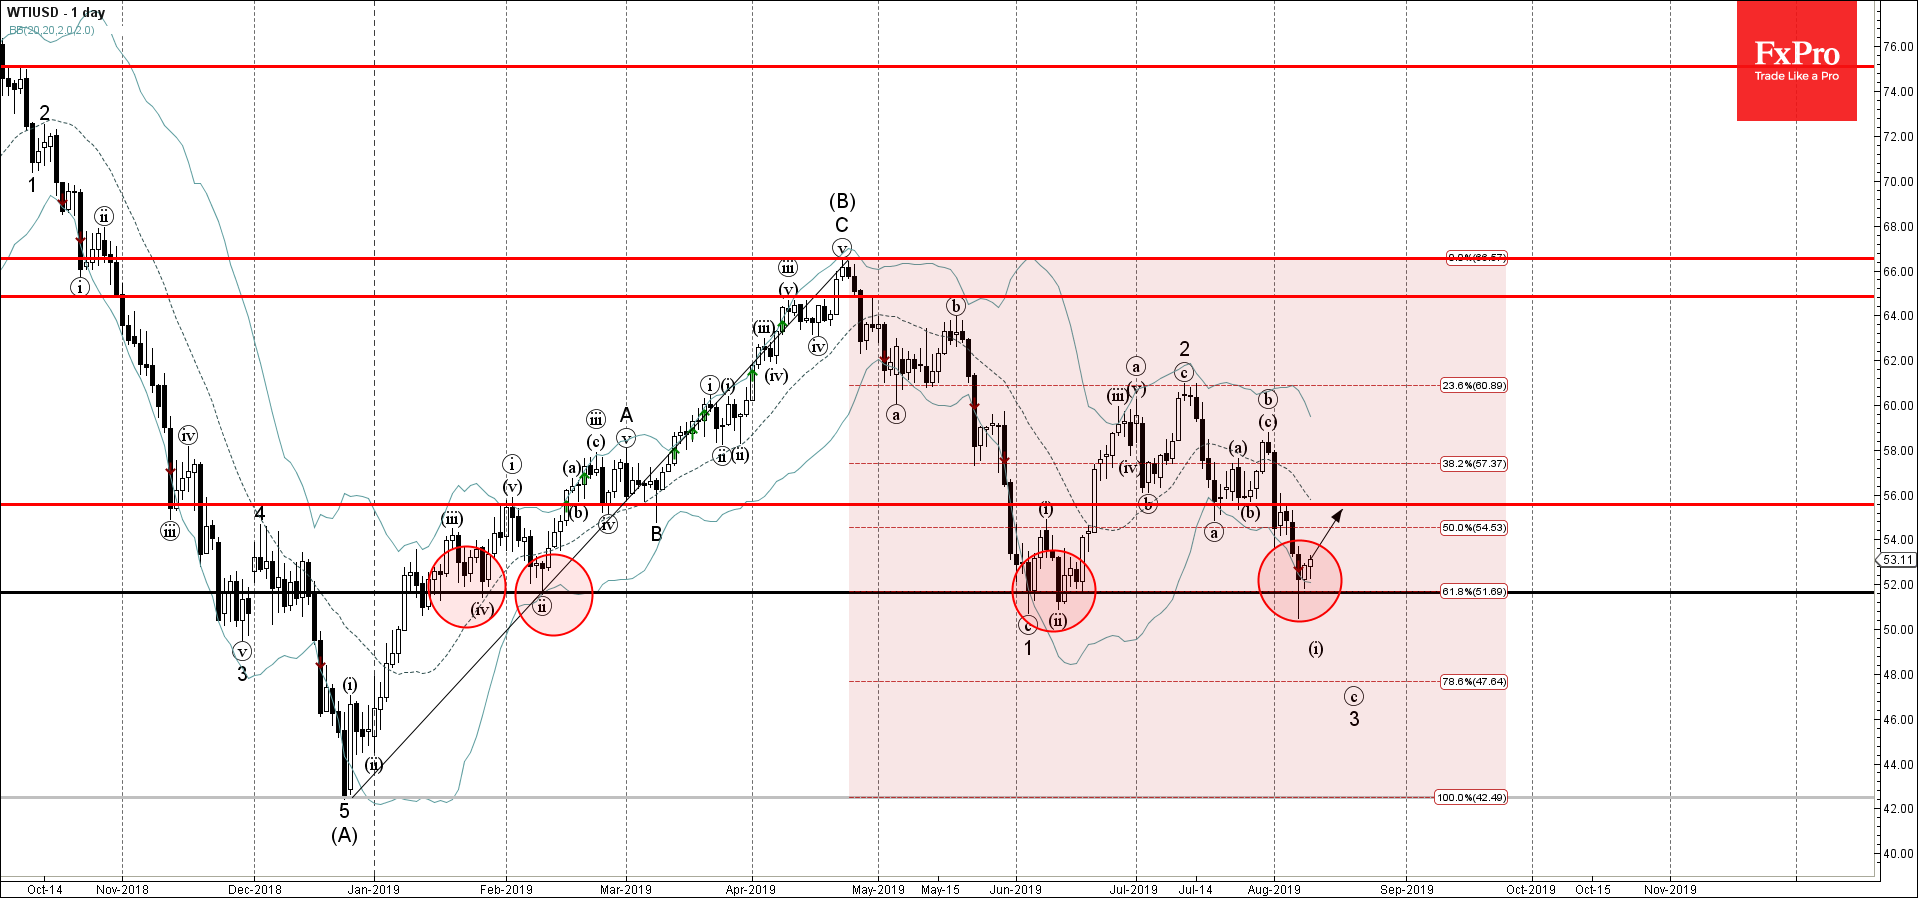
WTI recently reversed up sharply from the support zone lying between the multi-month support level 52.00 (which has been reversing the price from January) and the lower daily Bollinger Band.
This support zone was further strengthened by the 61.8% Fibonacci correction of the previous ABC correction (B) from December.
WTI is expected to rise further and retest the next resistance level 56.00 (former strong support from July).