Categories: Technical analysis

WTI Wave Analysis – 02 December, 2019

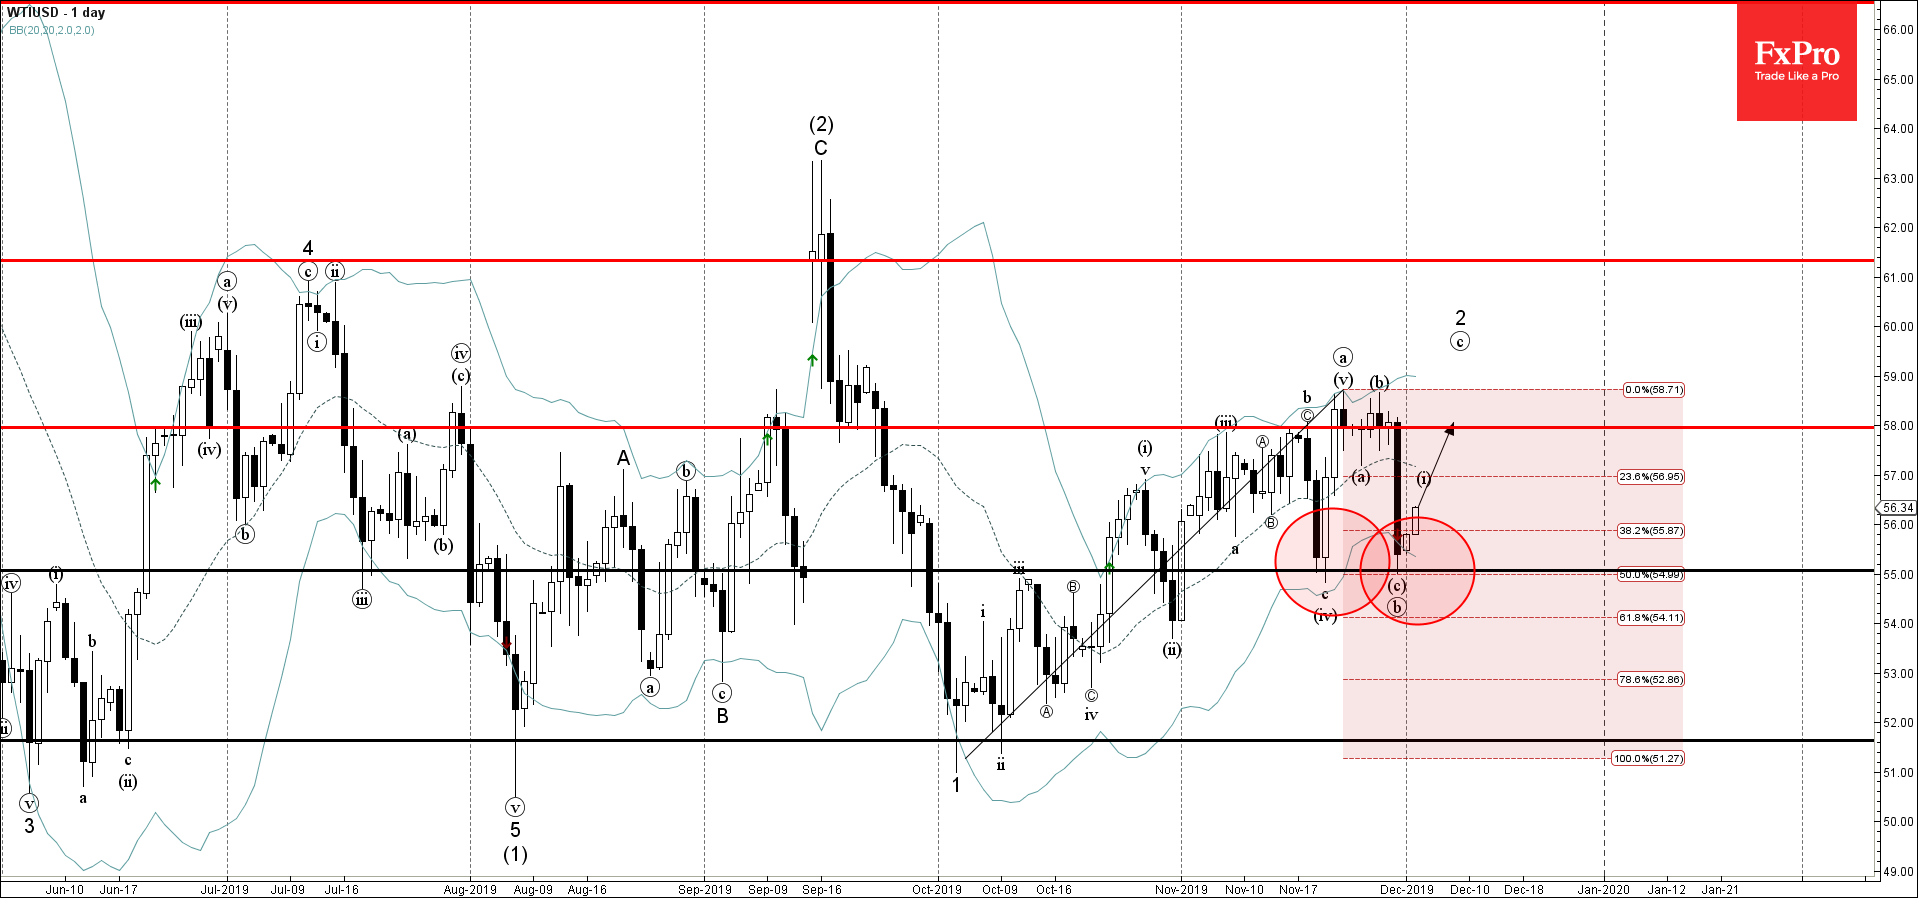
  • WTI reversed from support level 55,00
  • Likely to rise to 58,00

WTI recently reversed up from the support level 55,00 (low of the earlier wave (iv)) – strengthened by the lower daily Bollinger Band and 50% Fibonacci correction of the previous upward impulse from October.

The upward reversal from the support level 1.9070 started the active impulse wave (c).

WTI is expected to rise further toward the next resistance level 58,00 (which reversed the price multiple times in November).

The FxPro Tech Analysis Team

The FxPro technical experts prepare a daily analysis of the most active currency pairs (majors, crosses, exotics) and commodities. Selected instruments are reviewed on daily trends (D1, H4), using the active Elliott Wave setups, Japanese candlesticks, indicators, and support/resistance levels.

Share
Published by
The FxPro Tech Analysis Team
Tags: WTIUSD

Recent Posts

Silver: a possible long road down  

Silver has lost 2.6% since the start of the day on Tuesday to $26.4 per…

1 hour ago

Another Dip in Crypto Capitalization

Market picture  The crypto market capitalisation decreased by another 1.5% to $2.27 trillion, getting closer…

5 hours ago

ANF Wave Analysis 29 April 2024

ANF reversed from key support level 113.40 Likely to rise to resistance level 132.31 ANF…

20 hours ago

GBPUSD Wave Analysis 29 April 2024

- GBPUSD rising inside minor correction 2 - Likely to rise to resistance level 1.2700…

20 hours ago

Crypto Market Retreats Due to Overhang of Sellers

Market picture The crypto market has lost 3.3% in the last 24 hours to $2.3…

1 day ago

USDJPY Wave Analysis 26 April 2024

- USDJPY broke key resistance level 155.00 - Likely to rise to resistance level 160.00…

4 days ago

This website uses cookies