Categories: Technical analysis

WTI Wave Analysis – 02 April, 2020

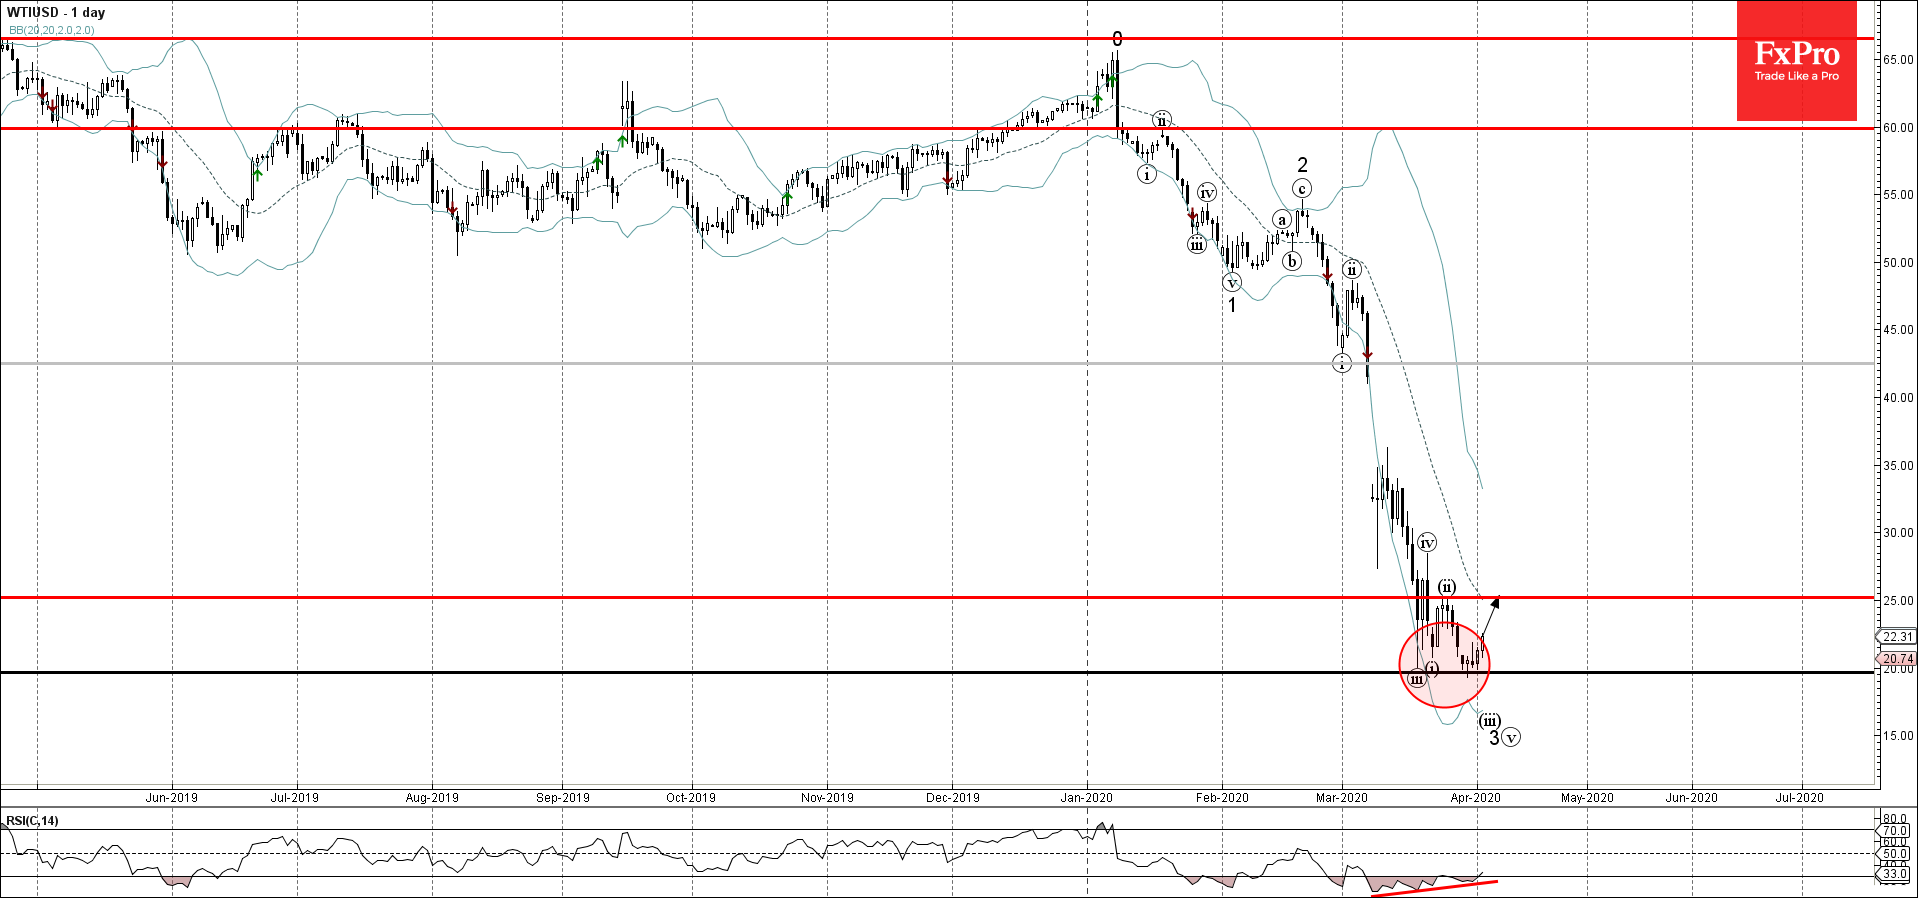
  • WTI reversed from key support level 20.00
  • Likely to rise to 25.00

WTI recently reversed up from the key support level 20.00 (which stopped the previous sharp impulse wave (i) in March), standing near the lower daily Bollinger Band.

The upward reversal from this support level stopped the previous impulse waves 3 and (iii).

Give the strength of the support level 20.00 and the clear bullish divergence on the daily RSI indicator – WTI is likely to rise further toward the next resistance level 25.00.

The FxPro Tech Analysis Team

The FxPro technical experts prepare a daily analysis of the most active currency pairs (majors, crosses, exotics) and commodities. Selected instruments are reviewed on daily trends (D1, H4), using the active Elliott Wave setups, Japanese candlesticks, indicators, and support/resistance levels.

Share
Published by
The FxPro Tech Analysis Team
Tags: WTIUSD

Recent Posts

The crypto market is stuck in the mud

Market Picture The crypto market has been hovering in a narrow range for the past…

44 minutes ago

FTSE 100 Wave Analysis – 17 March 2025

FTSE 100: ⬆️ Buy - FTSE 100 reversed from key support level 8425.00 - Likely…

17 hours ago

Alibaba Wave Analysis – 17 March 2025

Alibaba: ⬆️ Buy - Alibaba broke the key resistance level 145.00 - Likely to rise…

17 hours ago

EURNZD Wave Analysis – 17 March 2025

EURNZD: ⬇️ Sell - EURNZD reversed from long-term resistance level 1.9160 - Likely to fall…

21 hours ago

AUDUSD Wave Analysis – 17 March 2025

AUDUSD: ⬆️ Buy - AUDUSD broke resistance level 0.6350 - Likely to rise to resistance…

21 hours ago

Weak US retail sales might boost stocks

Weak US retail sales are adding to concerns of a potential recession, putting pressure on…

23 hours ago

This website uses cookies