Categories: Technical analysis

WTI Wave Analysis – 01 April, 2019

  • WTI broke resistance area
  • Further gains are likely

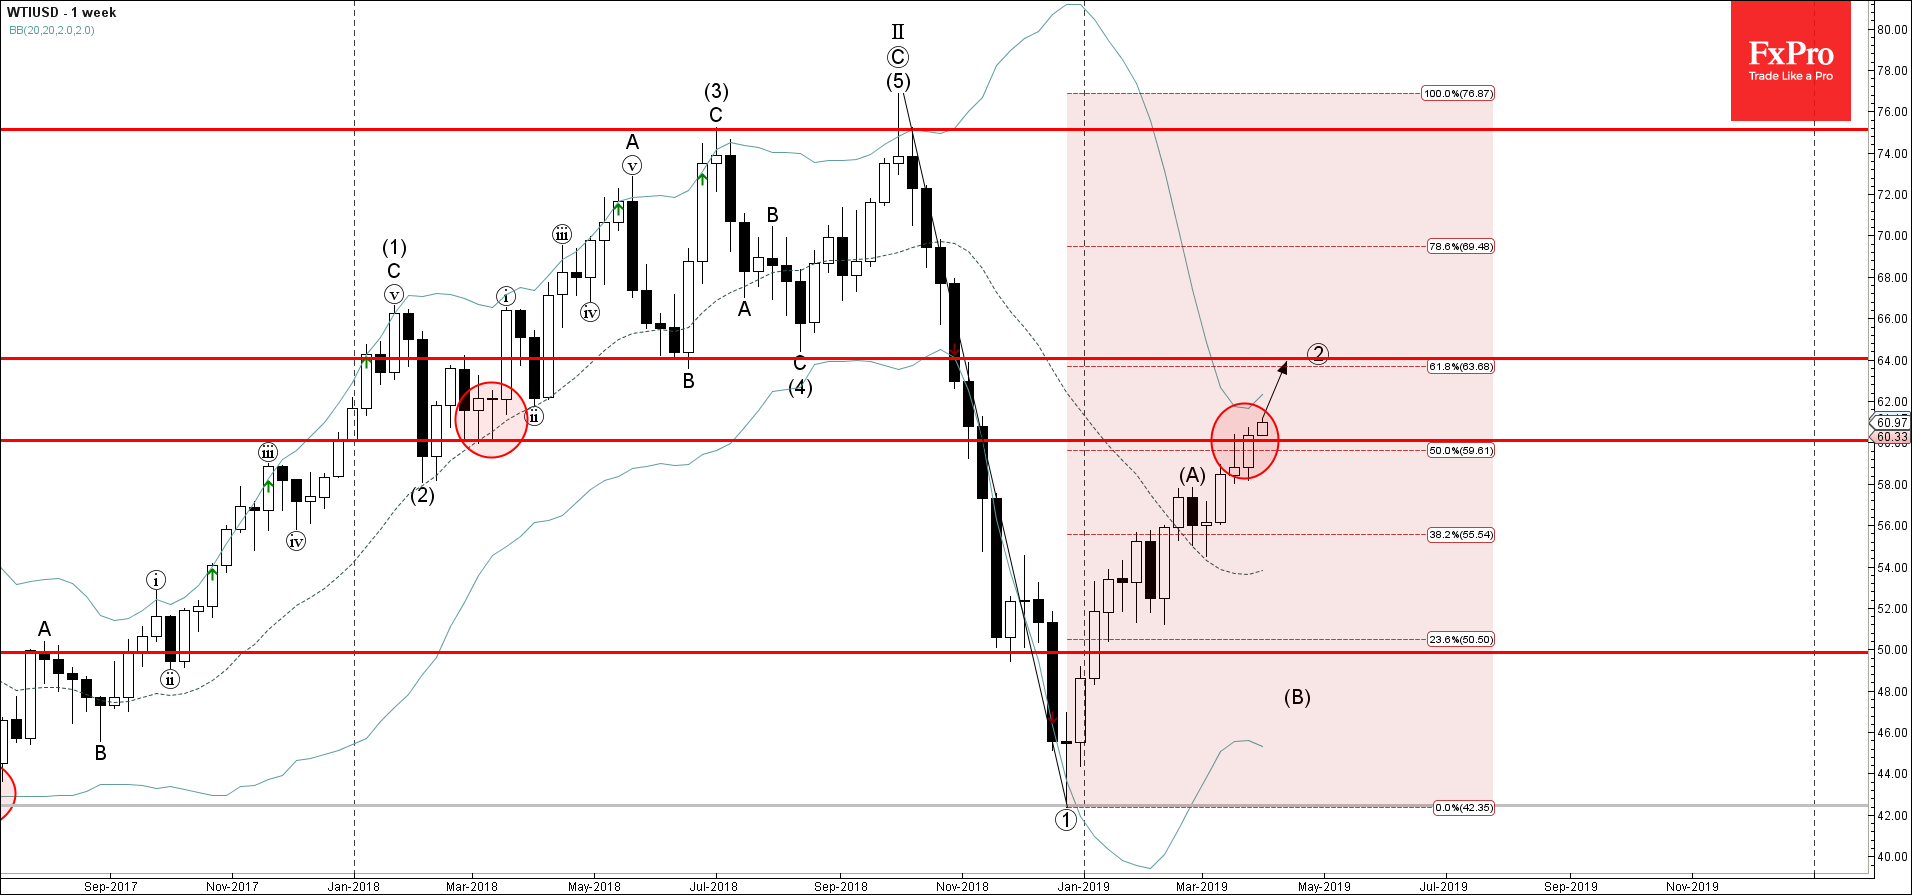
WTI continues to rise after the earlier breakout of the resistance area lying between the round resistance level 60.00 and the 50% Fibonacci correction of the previous sharp weekly downward impulse wave from last September.

The breakout of this resistance area should accelerate the active medium-term ABC correction ② from December.

WTI is expected to rise further and re-test the next resistance level 64.00 (target price for the completion of the active ABC correction ②).

AddThis Website Tools
The FxPro Tech Analysis Team

The FxPro technical experts prepare a daily analysis of the most active currency pairs (majors, crosses, exotics) and commodities. Selected instruments are reviewed on daily trends (D1, H4), using the active Elliott Wave setups, Japanese candlesticks, indicators, and support/resistance levels.

Share
Published by
The FxPro Tech Analysis Team
Tags: WTIUSD

Recent Posts

Netflix Wave Analysis – 25 March 2025

Netflix: ⬆️ Buy - Netflix broke resistance zone - Likely to rise to resistance level 1050.00…

1 hour ago

Goldman Sachs Wave Analysis – 25 March 2025

Goldman Sachs: ⬆️ Buy - Goldman Sachs continues daily uptrend - Likely to rise to…

1 hour ago

Nasdaq-100 Wave Analysis – 25 March 2025

Nasdaq-100: ⬆️ Buy - Nasdaq-100 broke resistance zone - Likely to rise to resistance level…

3 hours ago

Gold Wave Analysis – 25 March 2025

Gold: ⬆️ Buy - Gold reversed from support zone - Likely to rise to the…

3 hours ago

US Consumers Lose Confidence Over Trade Tariffs

US Consumer Confidence Index has dropped to a four-year low due to fears of tariff…

9 hours ago

Crypto market prepares to storm the trend line

The crypto market is facing selling pressure near the 200-day moving average, but if it…

12 hours ago