Categories: Technical analysis

WTI oil Wave Analysis 18 March, 2021

• WTI oil broke through support area

• Likely to test support level 59.15

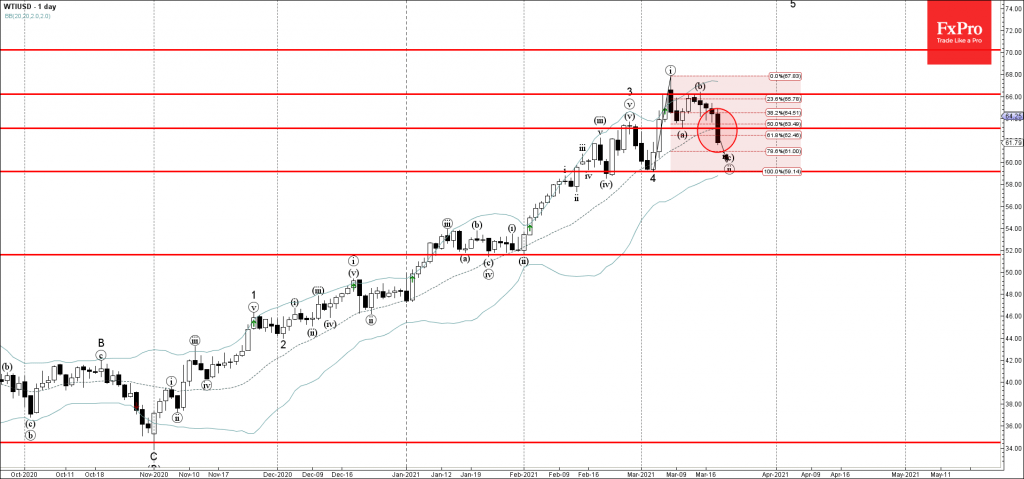
WTI oil today broke sharply through the support area located between the support level 63.10 (which stopped the previous minor corrective wave (a)) earlier this month) – coinciding with the 50% Fibonacci retracement of the upward impulse (i).

The breakout of this support area accelerated the active minor impulse wave c of the ABC correction (ii) from the start of this month.

Given the deterioration of the risk sentiment  – WTI oil is likely to fall further toward the next support level 59.15 (low of the previous waves (iv) and 4).

The FxPro Tech Analysis Team

The FxPro technical experts prepare a daily analysis of the most active currency pairs (majors, crosses, exotics) and commodities. Selected instruments are reviewed on daily trends (D1, H4), using the active Elliott Wave setups, Japanese candlesticks, indicators, and support/resistance levels.

Share
Published by
The FxPro Tech Analysis Team
Tags: wti

Recent Posts

Gold Wave Analysis – 12 December 2025

Gold: ⬇️ Sell - Gold reversed from strong resistance level 4350.00 - Likely to fall to…

2 days ago

EURGBP Wave Analysis – 12 December 2025

EURGBP: ⬆️ Buy - EURGBP reversed from support zone - Likely to rise to resistance level…

2 days ago

Filecoin Wave Analysis – 12 December 2025

Filecoin: ⬇️ Sell - Filecoin broke key support level 1.435 - Likely to fall to support…

2 days ago

Ethereum Wave Analysis – 12 December 2025

Ethereum: ⬇️ Sell - Ethereum reversed from resistance level 3400.00 - Likely to fall to support…

2 days ago

Pro News Weekly: Global Markets at a Turning Point

Welcome to Pro News Weekly! Here’s what is moving the markets: 💵 The Fed fails…

3 days ago

Crypto: slight rebound within a bear market

Crypto rebounds slightly in a bear market; resistance holds, optimism rises, but the outlook remains…

3 days ago

This website uses cookies