Categories: Technical analysis

WTI crude oil Wave Analysis – 4 July 2023


– WTI crude oil broke daily Triangle

– Likely to rise to resistance level 72.80

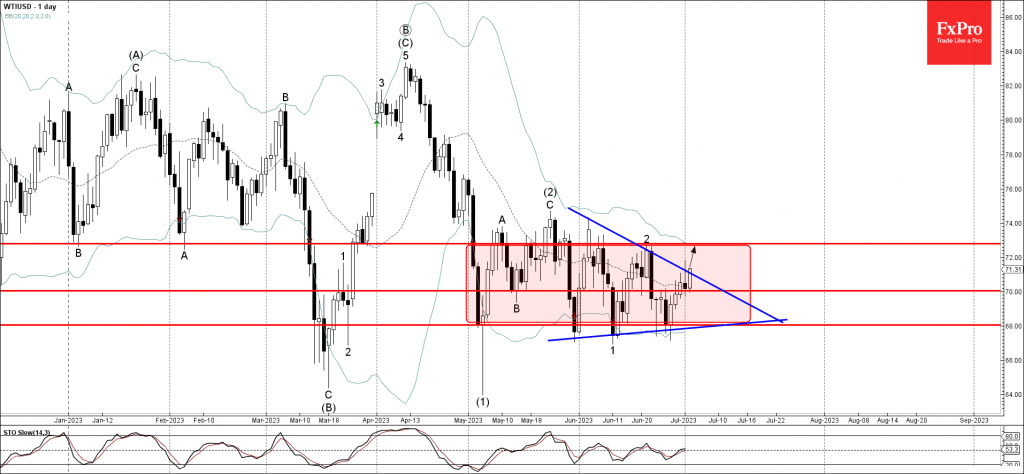
WTI crude oil recently broke the resistance trendline of the daily Triangle from the end of May.

The breakout of this resistance zone this Triangle follows the earlier breakout of the round resistance level 70.00, which strengthened the bullish pressure on this instrument.

Given the strength of the nearby powerful support level 68.00, WTI crude oil can be expected to rise further toward the next resistance level 72.80 (top of the previous minor correction 2 from June).

The FxPro Tech Analysis Team

The FxPro technical experts prepare a daily analysis of the most active currency pairs (majors, crosses, exotics) and commodities. Selected instruments are reviewed on daily trends (D1, H4), using the active Elliott Wave setups, Japanese candlesticks, indicators, and support/resistance levels.

Share
Published by
The FxPro Tech Analysis Team
Tags: wti

Recent Posts

Apple Wave Analysis 17 October 2024

- Apple reversed from key resistance level 237.00 - Likely to fall to support level 227.00…

10 hours ago

Aig Wave Analysis 17 October 2024

- Aig reversed from support level 76.60 - Likely to rise to resistance level 79.65 Aig recently…

10 hours ago

The Crypto Market Stabilises at the Top

Market Picture The cryptocurrency market remains steady at around $2.31 trillion in market capitalisation, mirroring…

19 hours ago

GBPCAD Wave Analysis 16 October 2024

- GBPCAD reversed from resistance zone - Likely to fall to support level 1.7750 GBPCAD…

1 day ago

USDCHF Wave Analysis 16 October 2024

- USDCHF broke resistance zone - Likely to rise to resistance level 0.8730 USDCHF currency…

1 day ago

Pound Suppressed by Weak Inflation

The British pound fell below the 1.30 level against the dollar after weak inflation data…

2 days ago

This website uses cookies