Categories: Technical analysis

WTI crude oil Wave Analysis 3 January 2025

– WTI crude oil broke resistance area

– Likely to rise to resistance level 76.00

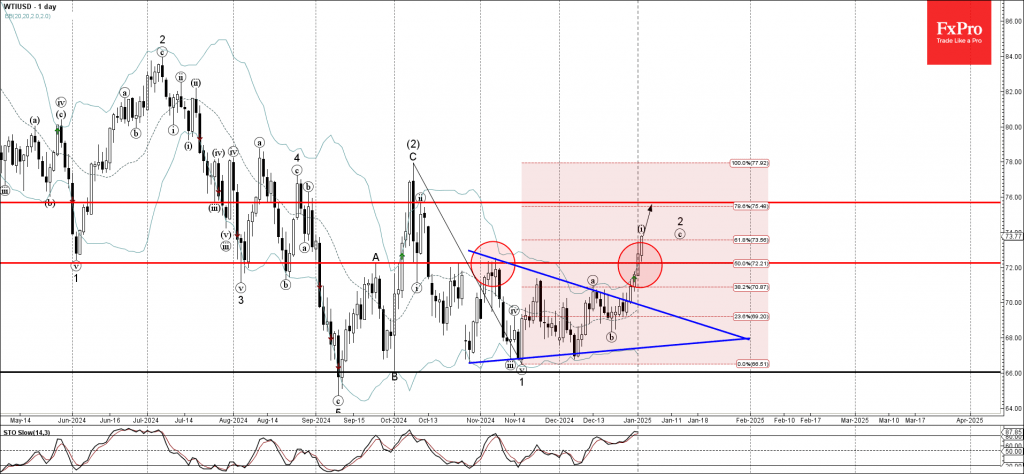
WTI crude oil rising sharply after the earlier breakout of the resistance area located between the key resistance level 72.25 (top of the previously broken daily Triangle) and the 50% Fibonacci correction of the previous downward impulse 1 from October.

The breakout of the resistance area accelerated the c-wave of the active ABC correction 2 from the middle of November.

WTI crude oil can be expected to rise to the next round resistance level 76.00 (former resistance from October and the target price for the completion of the active wave 2).

AddThis Website Tools
The FxPro Tech Analysis Team

The FxPro technical experts prepare a daily analysis of the most active currency pairs (majors, crosses, exotics) and commodities. Selected instruments are reviewed on daily trends (D1, H4), using the active Elliott Wave setups, Japanese candlesticks, indicators, and support/resistance levels.

Share
Published by
The FxPro Tech Analysis Team
Tags: wti

Recent Posts

Amazon Wave Analysis – 24 April 2025

Amazon: ⬆️ Buy - Amazon reversed from support zone - Likely to rise to resistance…

4 hours ago

DAX Wave Analysis – 24 April 2025

DAX: ⬆️ Buy - DAX broke resistance area - Likely to rise to resistance level…

4 hours ago

Gold Wave Analysis – 24 April 2025

Gold: ⬆️ Buy - Gold reversed from support area - Likely to rise to resistance…

4 hours ago

EURUSD Wave Analysis – 24 April 2025

EURUSD: ⬆️ Buy - EURUSD reversed from support area - Likely to rise to resistance…

4 hours ago

Dollar: Set to Bounce Back

The U.S. currency started the week by hitting three-year lows against a basket of key…

11 hours ago

Gold: volatility at the top

Gold's 5% rally in the first 30 hours of the trading week, and touching the…

13 hours ago