Categories: Technical analysis

WTI crude oil Wave Analysis – 26 June 2023

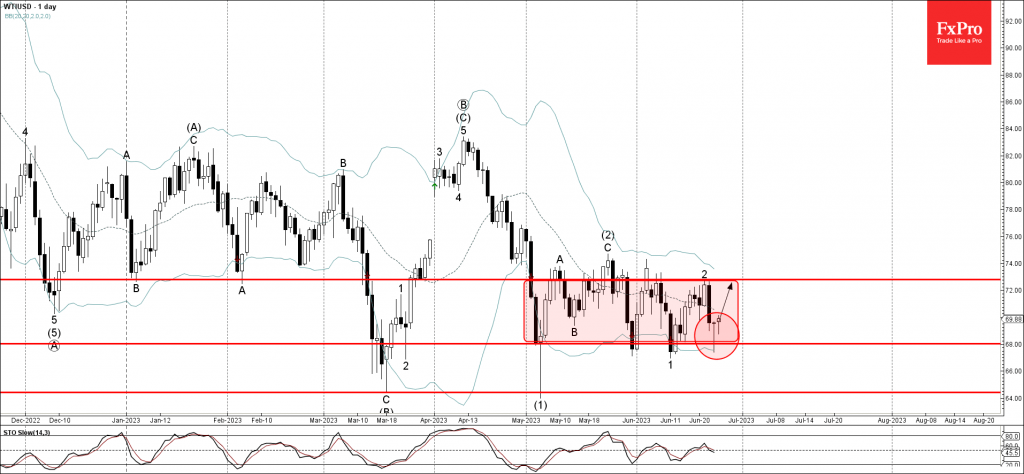
– WTI crude oil reversed from key support level 68.00

– Likely to rise to resistance level 72.80

WTI crude oil recently reversed up from the key support level 68.00 (which has been reversing the price from the start of May) , coinciding with the lower daily Bollinger Band.

The upward reversal from the support level 68.00 created the daily Japanese candlesticks reversal pattern Hammer.

Given the strength of the support level 68.00, WTI crude oil can be expected to rise further toward the next resistance level 72.80 (top of the previous correction 2).

The FxPro Tech Analysis Team

The FxPro technical experts prepare a daily analysis of the most active currency pairs (majors, crosses, exotics) and commodities. Selected instruments are reviewed on daily trends (D1, H4), using the active Elliott Wave setups, Japanese candlesticks, indicators, and support/resistance levels.

Share
Published by
The FxPro Tech Analysis Team
Tags: wti

Recent Posts

Dow Jones Wave Analysis – 17 December 2025

Dow Jones: ⬇️ Sell - Dow Jones reversed from resistance level 49000.00 - Likely to fall…

11 hours ago

Comcast Wave Analysis – 17 December 2025

Comcast: ⬆️ Buy - Comcast broke resistance area - Likely to rise to resistance level 31.00…

11 hours ago

Platinum Wave Analysis – 17 December 2025

Platinum: ⬆️ Buy - Platinum broke resistance level 1800.00 - Likely to rise to resistance…

12 hours ago

Silver Wave Analysis – 17 December 2025

Silver: ⬆️ Buy - Silver broke resistance zone - Likely to rise to resistance level…

12 hours ago

The labour market did not scare the Fed

The Fed is in no hurry to cut rates, and Hassett is unlikely to accelerate…

17 hours ago

The crypto rebound fades with a 40% drop possible

Crypto market faces renewed downward pressure; Bitcoin may drop further, with diverging forecasts for 2026…

19 hours ago

This website uses cookies