Categories: Technical analysis

WTI crude oil Wave Analysis 26 August 2024

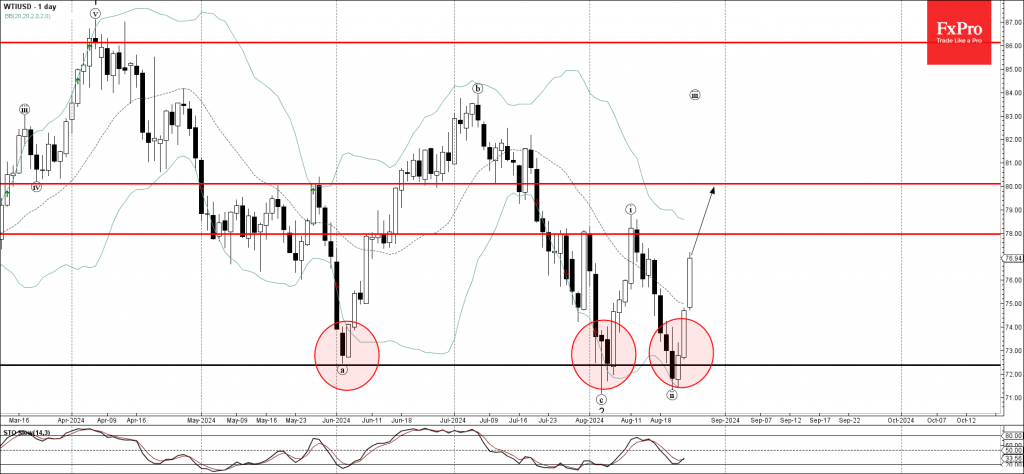
– WTI crude oil reversed from a strong support level 72.40

– Likely to rise to resistance level 78.00

WTI crude oil recently reversed up from the strong support level 72.40 (which has been reversing the price from the start of June) coinciding with the lower daily Bollinger Band.

The upward reversal from the support level 72.40 created the daily candlesticks reversal pattern Piercing Line which started the active impulse wave iii.

Given the strength of the active impulse wave iii, WTI crude oil can then be expected to rise to the next resistance level 78.00 – followed by 80.00.

The FxPro Tech Analysis Team

The FxPro technical experts prepare a daily analysis of the most active currency pairs (majors, crosses, exotics) and commodities. Selected instruments are reviewed on daily trends (D1, H4), using the active Elliott Wave setups, Japanese candlesticks, indicators, and support/resistance levels.

Share
Published by
The FxPro Tech Analysis Team
Tags: wti

Recent Posts

AUDCAD Wave Analysis 18 September 2024

- AUDCAD broke pivotal resistance level 0.9170 - Likely to rise to resistance level 0.9260…

6 hours ago

WTI Wave Analysis 18 September 2024

- WTI reversed from round resistance level 70.00 - Likely to fall to support level…

6 hours ago

Strong data didn’t derail markets from expectations of a 50bp Fed cut

US retail sales rose 0.1% m/m in August, better than forecast, but sales growth in…

13 hours ago

The crypto market gets a boost from stocks

Market Picture The crypto market has gained 2.1% in the last 24 hours to reach…

17 hours ago

MasterCard Wave Analysis 17 September 2024

- MasterCard broke round resistance level 500.00 - Likely to rise to the resistance level…

1 day ago

CHFJPY Wave Analysis 17 September 2024

- CHFJPY reversed from support zone - Likely to rise to the resistance level 168.45…

1 day ago

This website uses cookies