Categories: Technical analysis

WTI crude oil Wave Analysis – 23 September 2025

WTI crude oil: ⬆️ Buy

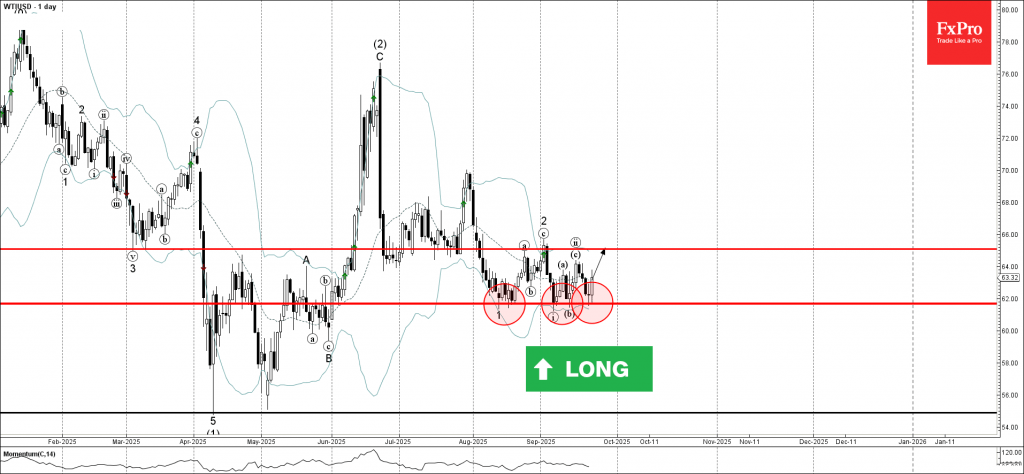
– WTI crude oil reversed up from the key support level 61.70

– Likely to rise to resistance level 65.00

WTI crude oil recently reversed up from the key support level 61.70 (which has been reversing the price from the start of August) intersecting with the lower daily Bollinger Band.

The upward reversal from the support level 61.70 will most likely form the daily Japanese candlesticks reversal pattern Morning Star – if the price closes today near the current levels.

Given the strength of the support level 61.70, WTI crude oil can be expected to rise to the next resistance level 65.00 (which stopped earlier waves a, 2 and ii).

The FxPro Tech Analysis Team

The FxPro technical experts prepare a daily analysis of the most active currency pairs (majors, crosses, exotics) and commodities. Selected instruments are reviewed on daily trends (D1, H4), using the active Elliott Wave setups, Japanese candlesticks, indicators, and support/resistance levels.

Share
Published by
The FxPro Tech Analysis Team
Tags: wti

Recent Posts

CHFJPY Wave Analysis – 9 January 2026

CHFJPY: ⬆️ Buy - CHFJPY reversed from support area - Likely to rise to resistance…

15 hours ago

Exxon Mobil Wave Analysis – 9 January 2026

Exxon Mobil: ⬆️ Buy - Exxon Mobil reversed from support area - Likely to rise…

15 hours ago

Pro News Weekly: Dollar Rebounds as Markets Test New Limits

Welcome to Pro News Weekly! Here’s what is shaping the markets: 💵 The U.S. dollar…

19 hours ago

Geopolitics will destroy the euro

•    EURUSD falls due to geopolitics and expectations of tariff removal •    Gold returns to…

1 day ago

Platinum Wave Analysis – 8 January 2026

Platinum: ⬇️ Sell - Platinum reversed from pivotal resistance level 150.00 - Likely to fall to…

2 days ago

Baidu Wave Analysis – 8 January 2026

Baidu: ⬇️ Sell - Baidu reversed from resistance zone - Likely to fall to support level…

2 days ago

This website uses cookies