Categories: Technical analysis

WTI crude oil Wave Analysis 23 April 2024

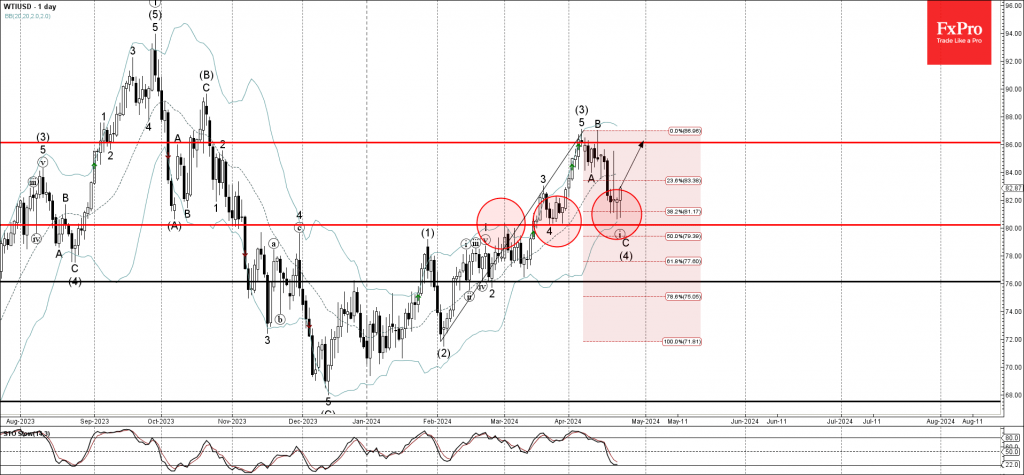
– WTI crude oil reversed from support zone

– Likely to rise to resistance level 86.00

WTI crude oil recently reversed up from the support zone lying between the round support level 80.00 (low of wave (iv) from March), lower daily Bollinger Band and the 38.2% Fibonacci correction of the upward impulse from February.

The upward reversal from the support level 80.00 stopped the previous ABC correction (4) – forming the daily Hammer.

Give the strength of the support level 80.00, WTI crude oil can be expected to rise further to the next resistance level 86.00 (which stopped waves (3) and B).

AddThis Website Tools
The FxPro Tech Analysis Team

The FxPro technical experts prepare a daily analysis of the most active currency pairs (majors, crosses, exotics) and commodities. Selected instruments are reviewed on daily trends (D1, H4), using the active Elliott Wave setups, Japanese candlesticks, indicators, and support/resistance levels.

Share
Published by
The FxPro Tech Analysis Team
Tags: wti

Recent Posts

Video: Dollar and Indices are trying to find footing after the fall

The dollar experienced a sell-off but rallied back up by the end of the week.…

3 hours ago

What is next: BoJ, Fed, SNB & BoE Rates

The new week will be packed with economic data and decisions from key central banks.…

6 hours ago

Dollar attempts to rebound after oversold conditions

Despite economic factors working against the dollar, its oversold condition helped it this week or…

7 hours ago

USDCAD Wave Analysis – 14 March 2025

USDCAD: ⬇️ Sell - USDCAD reversed from key resistance level 1.4500 - Likely to fall…

7 hours ago

Solana Wave Analysis – 14 March 2025

Solana: ⬆️ Buy - Solana reversed from the long-term support level 113.75 - Likely to…

7 hours ago

Adobe Wave Analysis – 13 March 2025

Adobe: ⬇️ Sell - Adobe broke round support level 400.00 - Likely to fall to…

23 hours ago