Categories: Technical analysis

Wheat Wave Analysis 30 October, 2020

• Wheat falling sharply

• Likely to reach 580.00

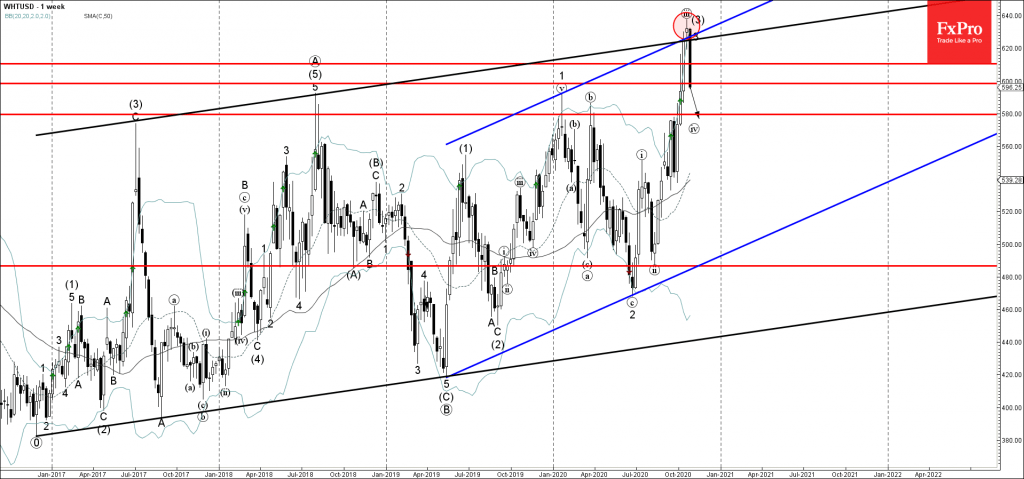
Wheat falling sharply after the recent downward reversal from the major resistance zone lying at the intersection of the two resistance trendlines of the weekly up channels from 2019 and 2016.

The downward reversal from this resistance zone will form the powerful weekly Japanese candlesticks reversal pattern Evening Star Doji – if the price closes this week near the current levels.

Wheat is likely to fall further toward the next support level 580.00 (former resistance level from the start of this year).

The FxPro Tech Analysis Team

The FxPro technical experts prepare a daily analysis of the most active currency pairs (majors, crosses, exotics) and commodities. Selected instruments are reviewed on daily trends (D1, H4), using the active Elliott Wave setups, Japanese candlesticks, indicators, and support/resistance levels.

Share
Published by
The FxPro Tech Analysis Team
Tags: wheat

Recent Posts

Video: Dollar and Indices are trying to find footing after the fall

The dollar experienced a sell-off but rallied back up by the end of the week.…

3 days ago

What is next: BoJ, Fed, SNB & BoE Rates

The new week will be packed with economic data and decisions from key central banks.…

3 days ago

Dollar attempts to rebound after oversold conditions

Despite economic factors working against the dollar, its oversold condition helped it this week or…

3 days ago

USDCAD Wave Analysis – 14 March 2025

USDCAD: ⬇️ Sell - USDCAD reversed from key resistance level 1.4500 - Likely to fall…

3 days ago

Solana Wave Analysis – 14 March 2025

Solana: ⬆️ Buy - Solana reversed from the long-term support level 113.75 - Likely to…

3 days ago

Adobe Wave Analysis – 13 March 2025

Adobe: ⬇️ Sell - Adobe broke round support level 400.00 - Likely to fall to…

3 days ago

This website uses cookies