Categories: Technical analysis

Wheat Wave Analysis – 21 May, 2019

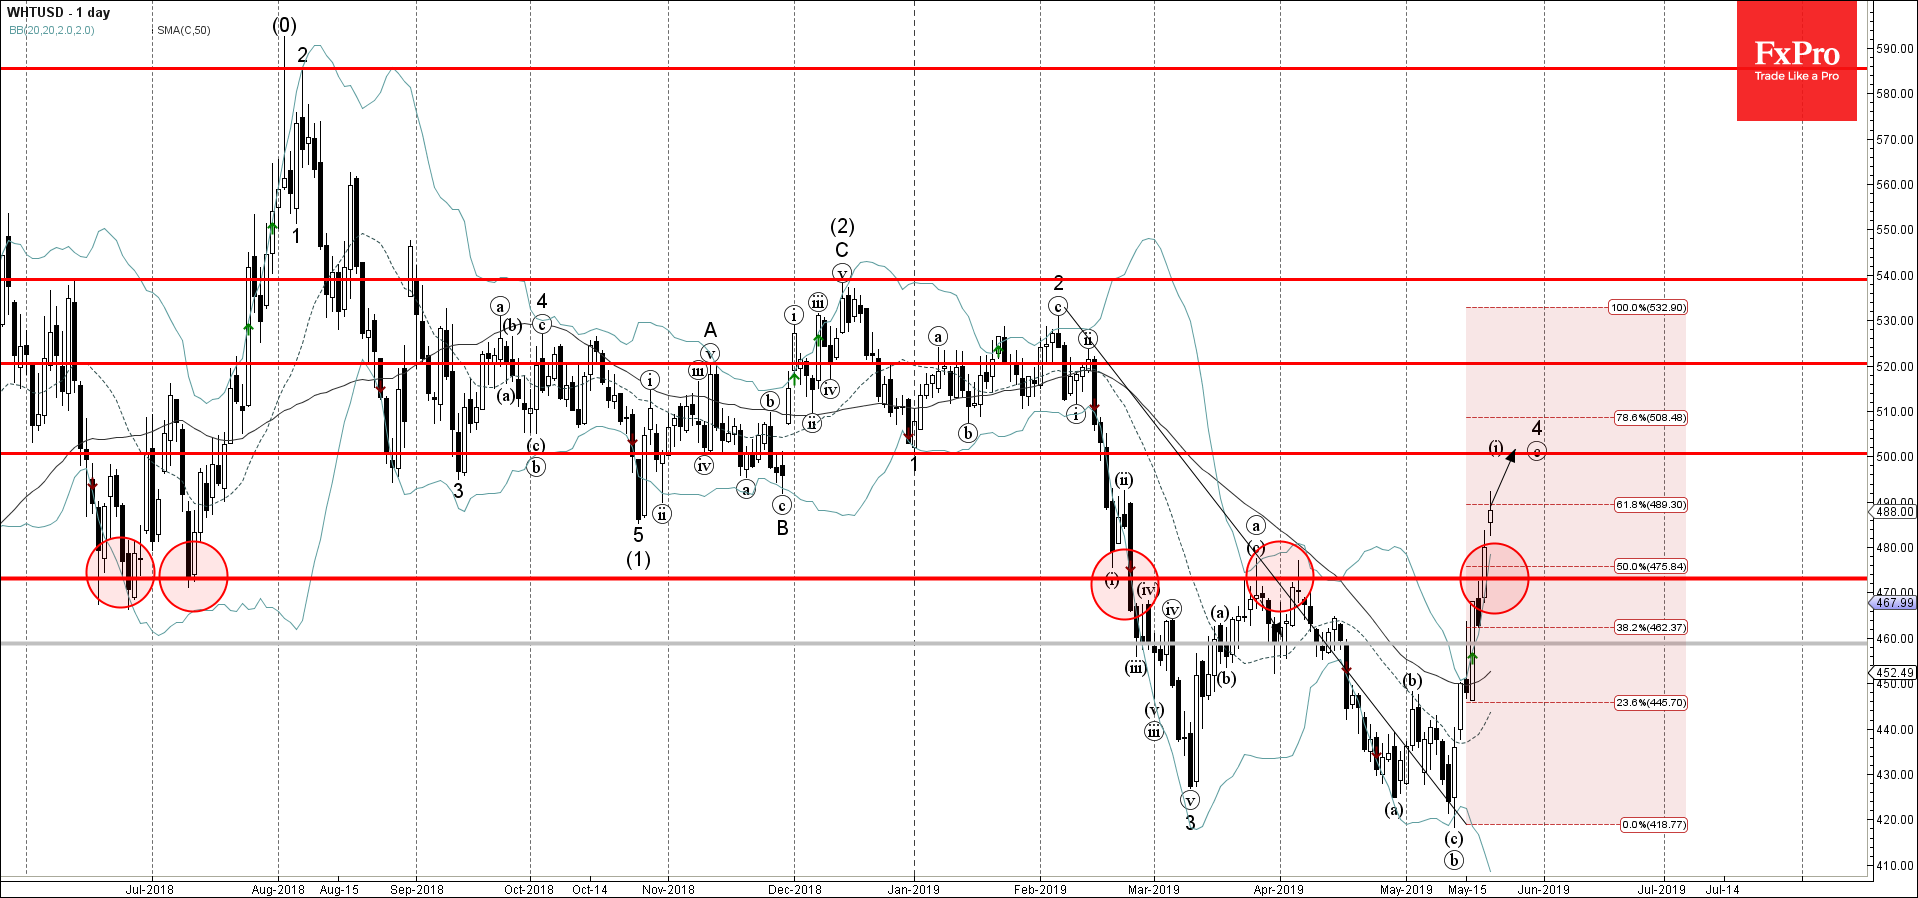
  • Wheat broke resistance level 473.00
  • Further gains are likely

Wheat continues to rise after the recent breakout of the resistance area lying between the key resistance level 473.00 (monthly high from March and April) and the 50% Fibonacci correction of the downward impulse from February.

The breakout of this resistance area accelerates the active short-term impulse wave C from the middle of May.

Wheat is expected to rise further and retest the next round resistance level 500.00 (target for the completion of the active impulse wave C).

AddThis Website Tools
The FxPro Tech Analysis Team

The FxPro technical experts prepare a daily analysis of the most active currency pairs (majors, crosses, exotics) and commodities. Selected instruments are reviewed on daily trends (D1, H4), using the active Elliott Wave setups, Japanese candlesticks, indicators, and support/resistance levels.

Share
Published by
The FxPro Tech Analysis Team
Tags: WHTUSD

Recent Posts

GBPUSD Wave Analysis – 18 March 2025

GBPUSD: ⬆️ Buy - GBPUSD reversed from support zone - Likely to rise to resistance…

1 hour ago

GBPAUD Wave Analysis – 18 March 2025

GBPAUD: ⬆️ Buy - GBPAUD reversed from the support zone - Likely to rise to…

1 hour ago

Solana Wave Analysis – 18 March 2025

Solana: ⬇️ Sell - Solana reversed from the resistance zone - Likely to fall to…

3 hours ago

CHFJPY Wave Analysis – 18 March 2025

CHFJPY: ⬆️ Buy - CHFJPY broke resistance zone - Likely to rise to resistance level…

3 hours ago

The crypto market is stuck in the mud

Market Picture The crypto market has been hovering in a narrow range for the past…

8 hours ago

FTSE 100 Wave Analysis – 17 March 2025

FTSE 100: ⬆️ Buy - FTSE 100 reversed from key support level 8425.00 - Likely…

1 day ago