Categories: Technical analysis

Wheat Wave Analysis – 21 May, 2020

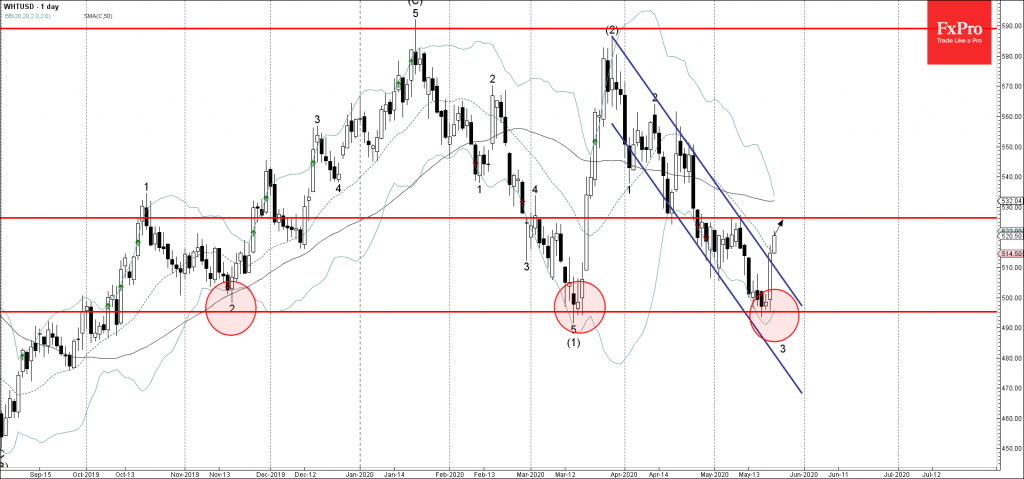
• Wheat broke daily down channel

• Likely to rise to 526.40

Wheat recently reversed up sharply from the key multi-month support level 495.00 and the lower daily Bollinger Band.

The price earlier broke the resistance trendline of the narrow daily down channel from the end of March – which strengthened the bullish pressure on this instrument.

Wheat is likely to extend the gains toward the next key resistance level 526.40 (former strong support from April, which reversed the price earlier this month).

AddThis Website Tools
The FxPro Tech Analysis Team

The FxPro technical experts prepare a daily analysis of the most active currency pairs (majors, crosses, exotics) and commodities. Selected instruments are reviewed on daily trends (D1, H4), using the active Elliott Wave setups, Japanese candlesticks, indicators, and support/resistance levels.

Share
Published by
The FxPro Tech Analysis Team
Tags: WHTUSD

Recent Posts

US sales jump gives USD relief, but is driven by fears

US Total retail sales rose 1.4% in March, beating the expected 1.3% after rising 0.2%…

29 minutes ago

Tariff news and resistance zone put pressure on crypto

The crypto market capitalisation decreased by 2.6% in 24 hours due to the announcement of…

4 hours ago

Gold Wave Analysis – 16 April 2025

Gold: ⬆️ Buy - Gold broke resistance zone - Likely to rise to the resistance…

8 hours ago

GBPUSD Wave Analysis – 16 April 2025

GBPUSD: ⬆️ Buy - GBPUSD broke key resistance level 1.3200 - Likely to rise to…

8 hours ago

Platinum Wave Analysis – 15 April 2025

Platinum: ⬆️ Buy - Platinum reversed from support level 905.00 - Likely to rise to…

17 hours ago

USDJPY Wave Analysis – 15 April 2025

USDJPY: ⬆️ Buy - USDJPY reversed from long-term support level 142.00 - Likely to rise…

17 hours ago