Categories: Technical analysis

Visa Wave Analysis – 11 October, 2019

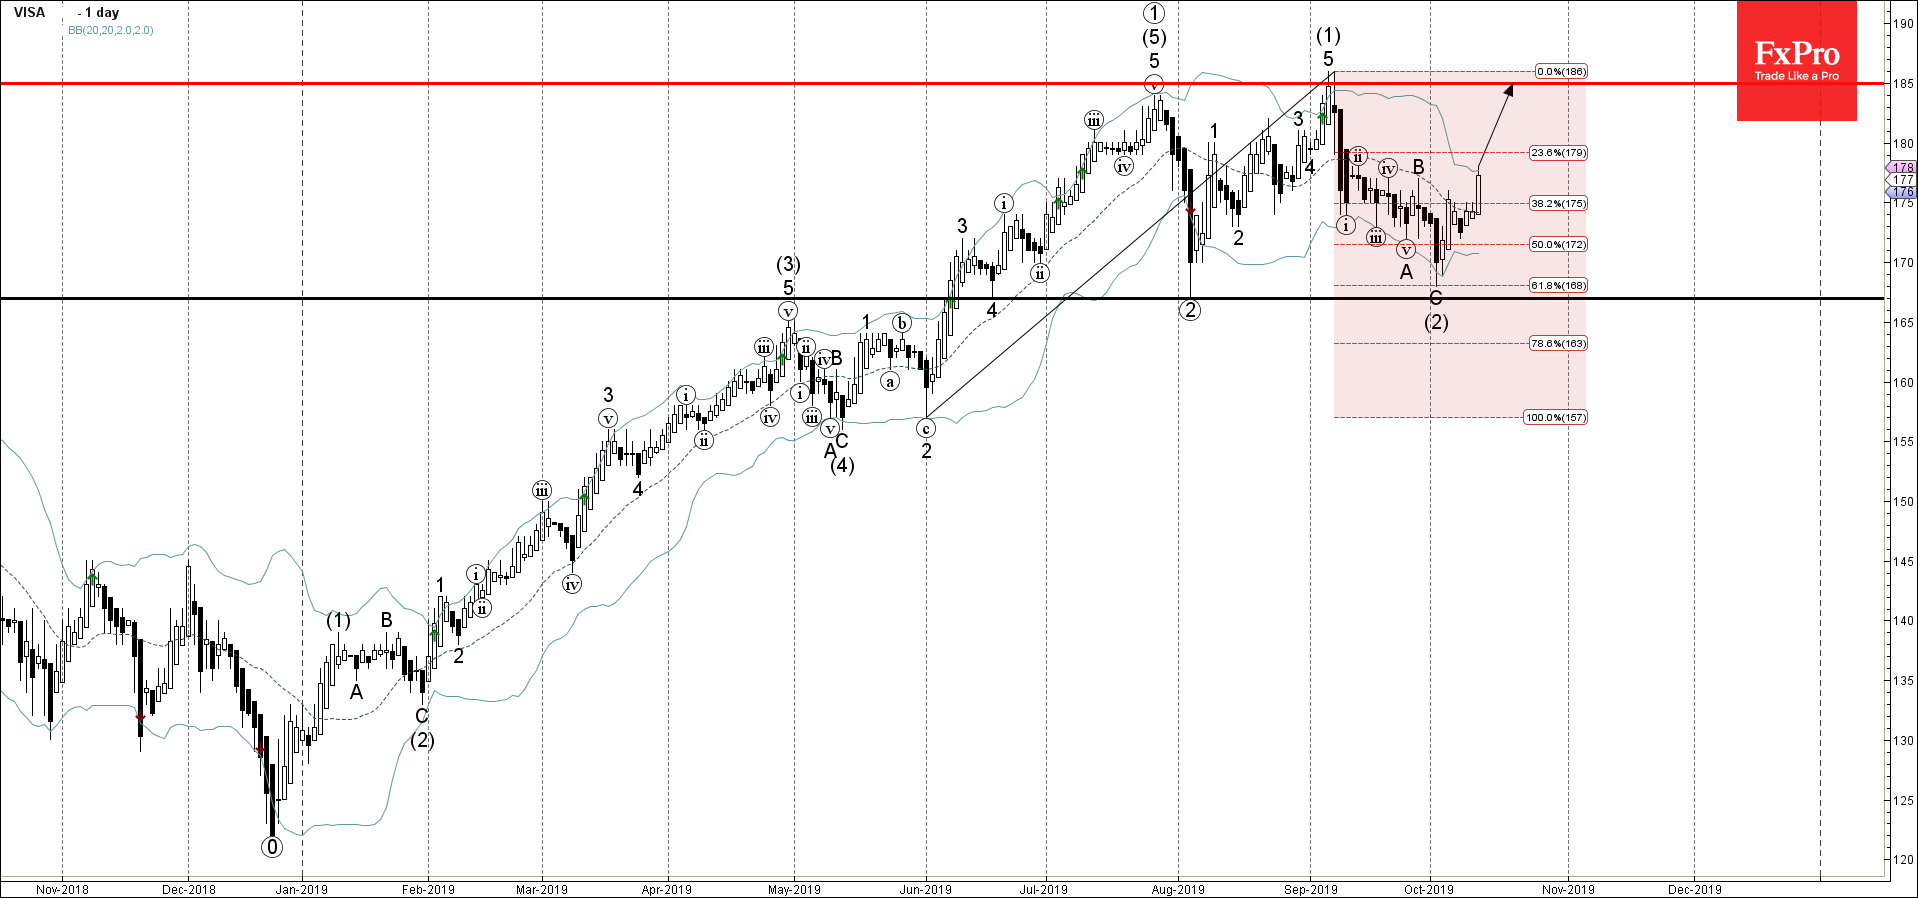
  • Visa rising inside impulse wave (3)
  • Likely to rise to 185.00

Visa recently reversed up from the support zone lying between the support level 167.00, lower daily Bollinger Band and the 61.8% Fibonacci correction of the previous upward impulse from June.

The upward reversal from this support zone started the active medium-term impulse wave (3).

Visa is expected to rise further and retest the next resistance level 185.00 (monthly high from July and September).

AddThis Website Tools
The FxPro Tech Analysis Team

The FxPro technical experts prepare a daily analysis of the most active currency pairs (majors, crosses, exotics) and commodities. Selected instruments are reviewed on daily trends (D1, H4), using the active Elliott Wave setups, Japanese candlesticks, indicators, and support/resistance levels.

Share
Published by
The FxPro Tech Analysis Team
Tags: Visa

Recent Posts

Video Pro News Weekly: Market Shake-Up. USD Struggles & Crypto’s Next Big Move!

Major market shifts underway! The US dollar hits resistance, stocks teeter on tariff tensions, and…

3 hours ago

Crypto’s dive

The crypto market has plunged, with a 1.3% drop in market capitalization in the last…

3 hours ago

AMD Wave Analysis – 28 March 2025

AMD: ⬇️ Sell - AMD reversed from pivotal resistance level 115.00 - Likely to fall…

3 days ago

Google Wave Analysis – 28 March 2025

Google: ⬇️ Sell - Google broke key support level 160.00 - Likely to fall to…

3 days ago

Gold Wave Analysis – 28 March 2025

Gold: ⬆️ Buy - Gold broke resistance level 3050.00 - Likely to rise to resistance…

3 days ago

Ethereum Wave Analysis – 28 March 2025

Ethereum: ⬇️ Sell - Ethereum reversed from the resistance level 2120.00 - Likely to fall…

3 days ago