Categories: Technical analysis

Verizon Wave Analysis – 11 December, 2019

  • Verizon approached strong resistance level 61.20
  • Likely to fall to 60.53

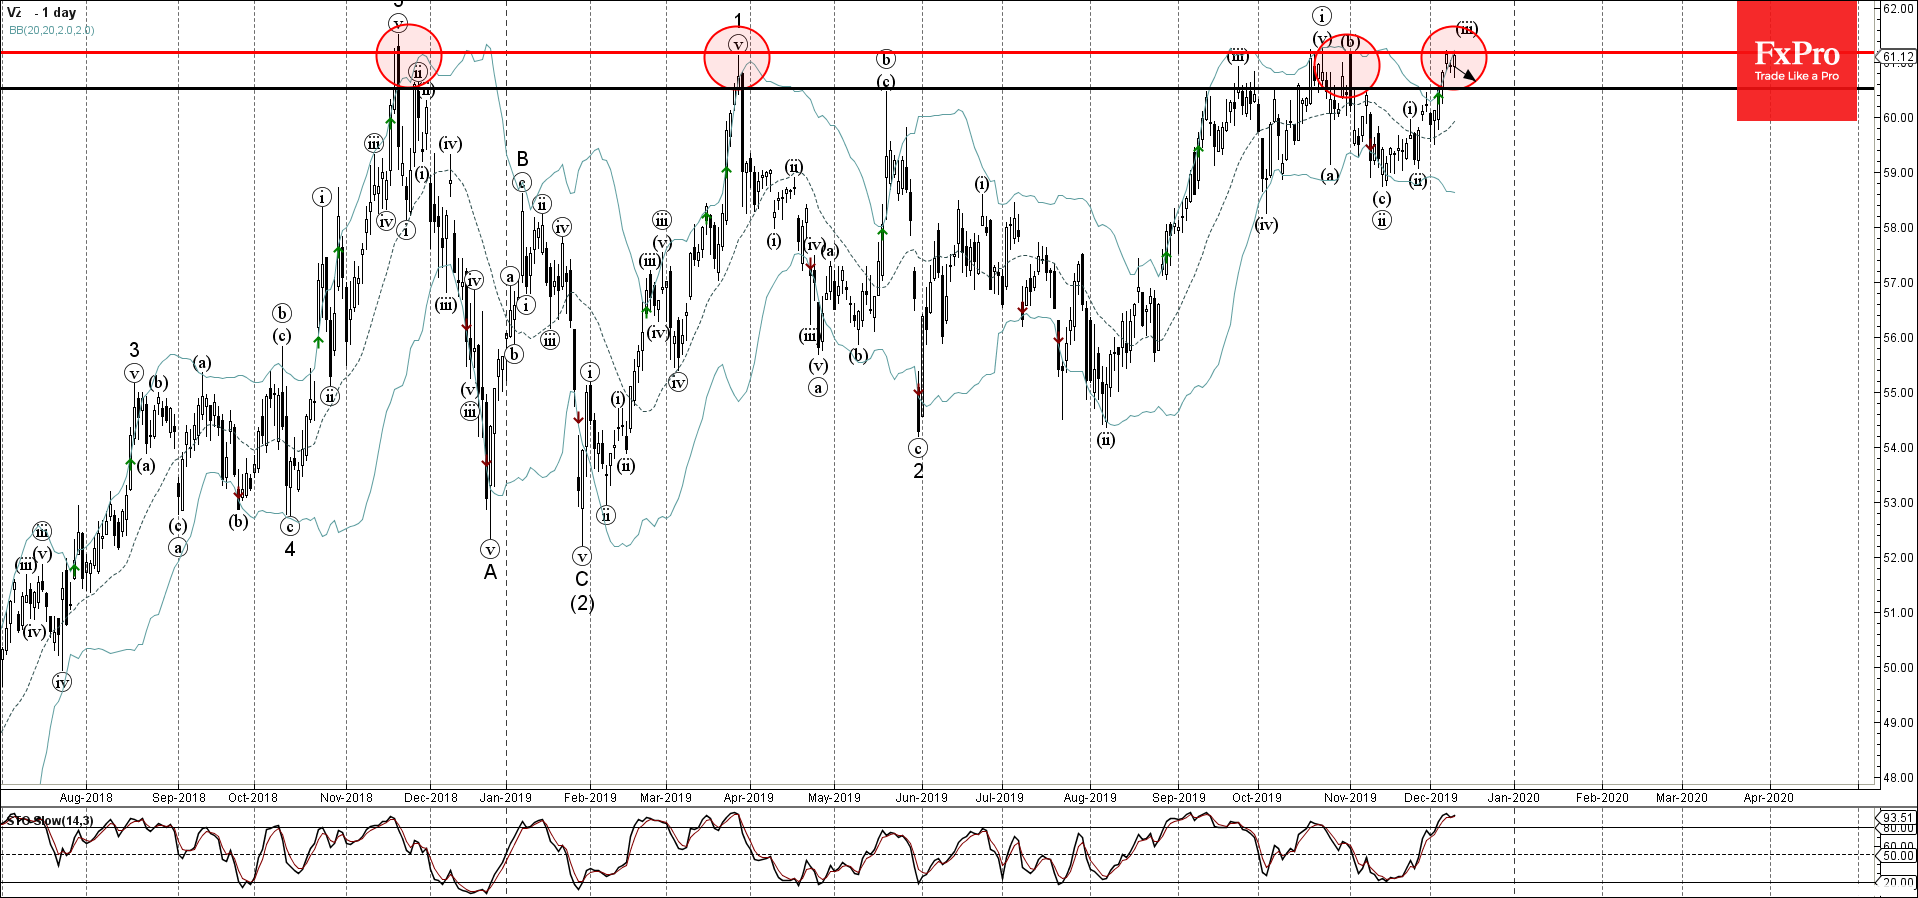
Verizon is currently trading close to the major, long-term resistance level 61.20 (which has persistently reversed the price from November of 2018, as can be seen on the daily Verizon chart below).

The resistance zone near the resistance level 61.20 is strengthened by the upper daily Bollinger Band.

Given the strongly overbought daily Stochastic – Verizon is expected to fall further toward the next support level 60.5 (former resistance from November).

The FxPro Tech Analysis Team

The FxPro technical experts prepare a daily analysis of the most active currency pairs (majors, crosses, exotics) and commodities. Selected instruments are reviewed on daily trends (D1, H4), using the active Elliott Wave setups, Japanese candlesticks, indicators, and support/resistance levels.

Share
Published by
The FxPro Tech Analysis Team
Tags: VZ

Recent Posts

Solana Wave Analysis – 5 December 2025

Solana: ⬇️ Sell - Solana reversed from resistance zone - Likely to fall to support…

33 minutes ago

EURAUD Wave Analysis – 5 December 2025

EURAUD : ⬇️ Sell - EURAUD broke the support level 1.7600 - Likely to fall…

34 minutes ago

Forex has set its priorities

In 2026, experts favour the yen, see modest euro growth, and expect pressure on the…

5 hours ago

Bear market rebound in crypto is likely to continue

Crypto rebounds continue; Bitcoin faces resistance, with a mixed market outlook ahead, as regulatory changes…

6 hours ago

Coca-Cola Wave Analysis – 4 December 2025

Coca-Cola: ⬇️ Sell - Coca-Cola reversed from long-term resistance level 73.25 - Likely to fall to…

19 hours ago

DraftKings Wave Analysis – 4 December 2025

DraftKings: ⬆️ Buy - DraftKings reversed from support zone - Likely to rise to resistance level…

19 hours ago

This website uses cookies