Categories: Technical analysis

Verizon Wave Analysis 1 February, 2021

• Sugar reversed from resistance area

• Likely to fall to support level 53.75

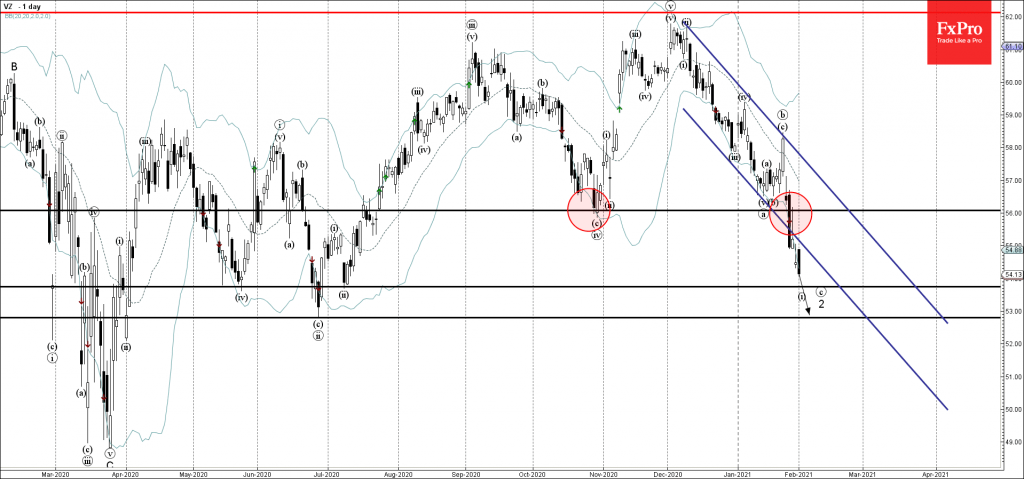
Verizon recently reversed down from the resistance area lying between the key resistance level 56.00 (former powerful support from October) and the lower trendline of the recently broken down channel from December.

The downward reversal from this resistance area continues the (c)-wave of the active medium-term ABC correction 2 from the start of December.

Verizon can be expected to fall further toward the next support level 53.75 (July’s low) – followed by 52.80 (June’s low).

AddThis Website Tools
The FxPro Tech Analysis Team

The FxPro technical experts prepare a daily analysis of the most active currency pairs (majors, crosses, exotics) and commodities. Selected instruments are reviewed on daily trends (D1, H4), using the active Elliott Wave setups, Japanese candlesticks, indicators, and support/resistance levels.

Share
Published by
The FxPro Tech Analysis Team

Recent Posts

Apple Wave Analysis – 20 March 2025

Apple: ⬇️ Sell - Apple reversed from resistance level 220.00 - Likely to fall to…

3 hours ago

IBM Wave Analysis – 20 March 2025

IBM: ⬆️ Buy - IBM reversed from support zone - Likely to rise to resistance…

3 hours ago

AUDNZD Wave Analysis – 20 March 2025

AUDNZD: ⬆️ Buy - AUDNZD reversed from key support level 1.0930 - Likely to rise…

5 hours ago

EURCAD Wave Analysis – 20 March 2025

EURCAD: ⬇️ Sell - EURCAD reversed from the resistance zone - Likely to fall to…

5 hours ago

Crypto Market Testing Resistance

The crypto market has increased by over 5% and is nearing the $2.9 trillion. The…

10 hours ago

Gold Wave Analysis – 19 March 2025

Gold: ⬆️ Buy - Gold continues daily uptrend - Likely to rise to resistance level…

1 day ago