Categories: Technical analysis

Vale Wave Analysis 27 November, 2020

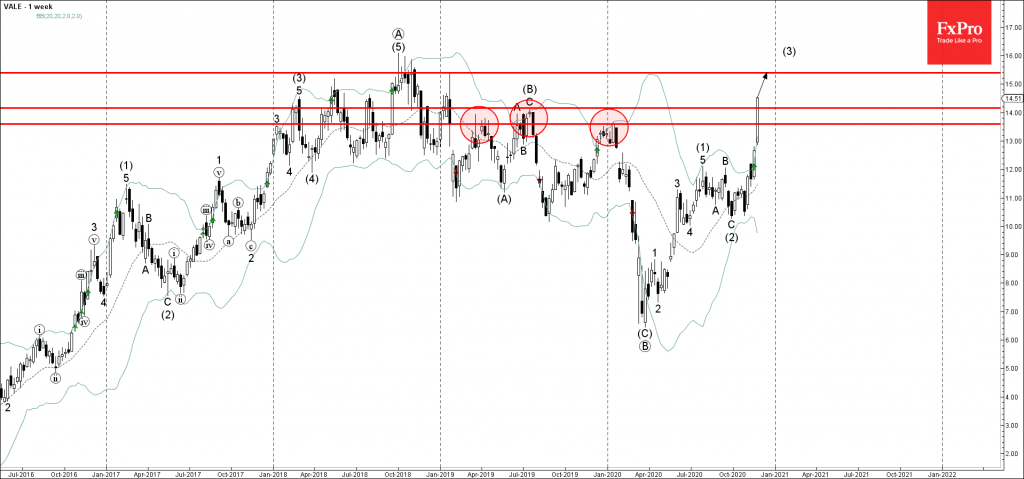
• Vale rising inside weekly upward impulse sequence (3)

• Likely to reach 15.40

Vale opened with the upward gap following the earlier breakout of the two powerful resistance levels 13.60 (monthly high from January) and 14.15 (former multi-month high from the middle of 2019).

The breakout of these strong resistance levels accelerated the active weekly upward impulse sequence (3) from September.

Vale is expected to rise further toward the next major resistance level 15.40 (former yearly high from the start of 2019).

The FxPro Tech Analysis Team

The FxPro technical experts prepare a daily analysis of the most active currency pairs (majors, crosses, exotics) and commodities. Selected instruments are reviewed on daily trends (D1, H4), using the active Elliott Wave setups, Japanese candlesticks, indicators, and support/resistance levels.

Share
Published by
The FxPro Tech Analysis Team

Recent Posts

Brent Crude oil Wave Analysis – 13 January 2026

Brent Crude oil ⬆️ Buy - Brent Crude oil rising inside impulse wave c -…

8 hours ago

USDJPY Wave Analysis – 13 January 2026

USDJPY ⬆️ Buy - USDJPY broke resistance area - Likely to rise to resistance level…

8 hours ago

Exxon Mobil Wave Analysis – 13 January 2026

Exxon Mobil ⬆️ Buy - Exxon Mobil broke resistance level 125.60 - Likely to rise…

8 hours ago

BNB Wave Analysis – 13 January 2026

Brent Crude oil ⬆️ Buy - BNB broke out of sideways price range - Likely…

8 hours ago

A slightly weaker CPI was not enough to break through the highs

US CPI data a bit softer than forecasts, sparking brief market optimism, but resistance remains.…

14 hours ago

Pro News Flash: Global Tensions Fuel a Fresh Oil Rally

🛢️ Oil prices are finding fresh strength as geopolitical tensions in the Middle East reignite…

14 hours ago

This website uses cookies