Categories: Technical analysis

USDJPY Wave Analysis 7 October, 2020

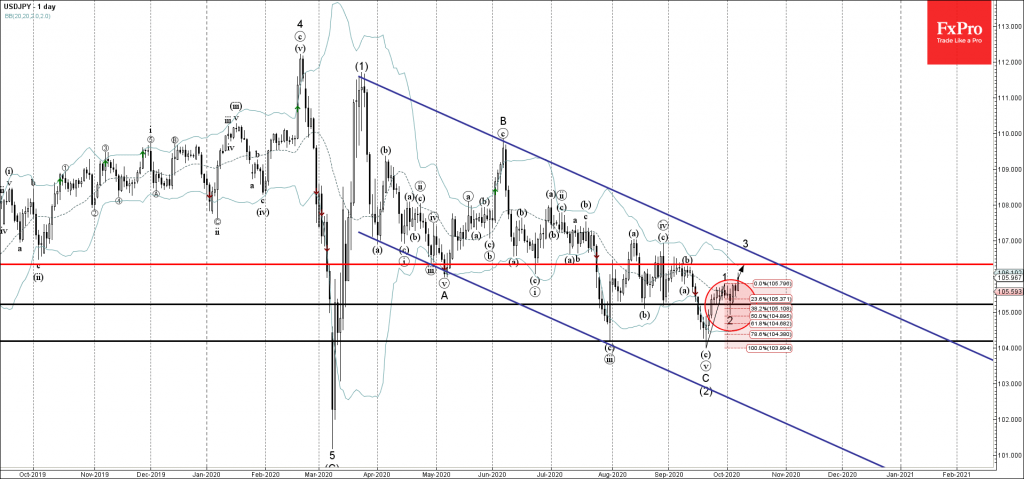
• USDJPY reversed from support area

• Likely to rise to 106.30

USDJPY recently reversed up from the support area lying between the support level 105.20 and the 38.2% Fibonacci correction of the previous upward impulse wave 1 from September.

The upward reversal from this support area started the active short-term impulse wave 3 – which belongs to the higher order impulse wave (3).

USDJPY is likely to rise further toward the next resistance level 106.30 (top of the previous short-term correction (b) from the start of last month).

The FxPro Tech Analysis Team

The FxPro technical experts prepare a daily analysis of the most active currency pairs (majors, crosses, exotics) and commodities. Selected instruments are reviewed on daily trends (D1, H4), using the active Elliott Wave setups, Japanese candlesticks, indicators, and support/resistance levels.

Share
Published by
The FxPro Tech Analysis Team
Tags: USDJPY

Recent Posts

CADJPY Wave Analysis – 26 December 2025

CADJPY: ⬆️ Buy - CADJPY broke resistance level 114.30 - Likely to rise to resistance…

14 hours ago

Toncoin Wave Analysis – 26 December 2025

Toncoin: ⬆️ Buy - Toncoin reversed from support zone - Likely to rise to resistance…

14 hours ago

Nvidia Wave Analysis – 26 December 2025

Nvidia: ⬆️ Buy - Nvidia reversed from support zone - Likely to rise to resistance…

14 hours ago

Palladium Wave Analysis – 26 December 2025

Palladium: ⬆️ Buy - Palladium reversed from support zone - Likely to rise to resistance…

14 hours ago

AUDUSD Wave Analysis – 24 December 2025

AUDUSD: ⬆️ Buy - AUDUSD broke key resistance level 0.6690 - Likely to rise to…

3 days ago

Tron Wave Analysis – 24 December 2025

Tron: ⬇️ Sell - Tron reversed from resistance zone - Likely to fall to support…

3 days ago

This website uses cookies