Categories: Technical analysis

USDJPY Wave Analysis 31 October 2023

– USDJPY broke key resistance level 150.85

– Likely to rise to resistance level 151.90

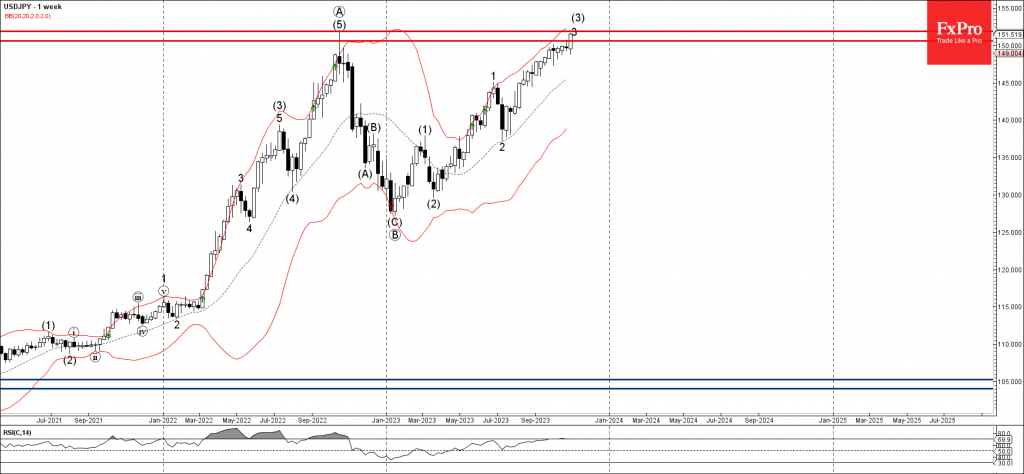
USDJPY recently broke the key resistance level 150.85 (top of the previous daily Evening Star reversal pattern from last week).

The breakout of the resistance level 150.85 accelerated the active medium-term impulse wave (3) from the March.

Given the clear weekly and daily uptrend, USDJPY can be expected to rise further toward the next resistance level 151.90 (which stopped the weekly uptrend in 2022) – from where the downward correction is likely.

The FxPro Tech Analysis Team

The FxPro technical experts prepare a daily analysis of the most active currency pairs (majors, crosses, exotics) and commodities. Selected instruments are reviewed on daily trends (D1, H4), using the active Elliott Wave setups, Japanese candlesticks, indicators, and support/resistance levels.

Share
Published by
The FxPro Tech Analysis Team
Tags: USDJPY

Recent Posts

Weak Chinese data paves the way for lower yuan

Saturday's statistics from China added to fears of a slowdown in the world's second-largest economy,…

6 hours ago

A new local peak in crypto?

Market Picture The crypto market started the weekend on a positive note but has been…

12 hours ago

Fed rate decision: intrigue returns

Influential financial media are promoting the need for a 50-basis point rate cut. The Fed's…

2 days ago

GBPCAD Wave Analysis 13 September 2024

GBPCAD reversed from strong resistance level 1.7850 Likely to fall to support level 1.7700 GBPCAD…

3 days ago

Ebay Wave Analysis 13 September 2024

- Ebay broke resistance level 62.00   - Likely to rise to the resistance level…

3 days ago

Gold broke through the ceiling

After three weeks of consolidation, gold moved decisively upwards, hitting a record above $2572 per…

3 days ago

This website uses cookies