Categories: Technical analysis

USDJPY Wave Analysis – 31 July 2025

USDJPY: ⬆️ Buy

– USDJPY broke resistance zone

– Likely rise to resistance level 152.00

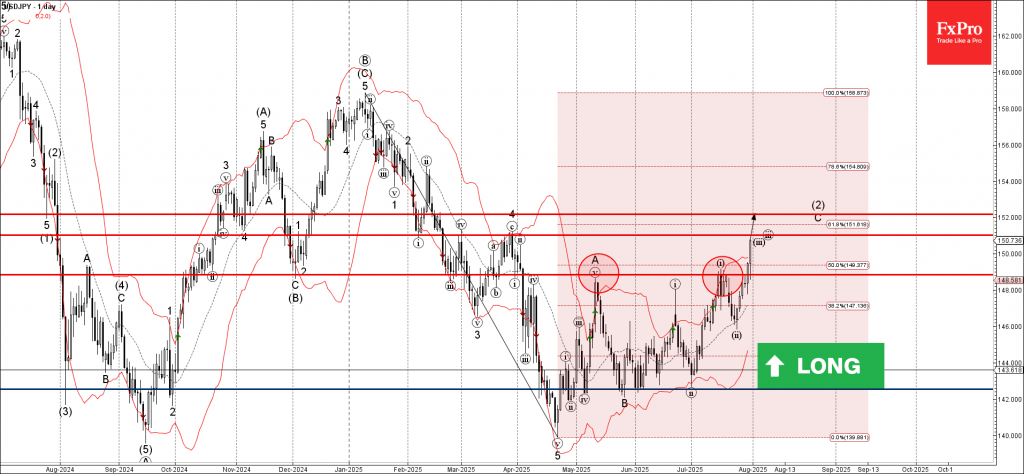
USDJPY currency pair recently broke the resistance zone located between the resistance level 148.85 (which stopped earlier waves A and i) and the 50% Fibonacci correction of the downward impulse from January.

The breakout of this resistance zone accelerated the active impulse wave c, which belongs to medium-term ABC correction (2) from April.

USDJPY currency pair can be expected to rise further to the next resistance level 152.00 (target price for the completion of the active impulse wave C).

The FxPro Tech Analysis Team

The FxPro technical experts prepare a daily analysis of the most active currency pairs (majors, crosses, exotics) and commodities. Selected instruments are reviewed on daily trends (D1, H4), using the active Elliott Wave setups, Japanese candlesticks, indicators, and support/resistance levels.

Share
Published by
The FxPro Tech Analysis Team
Tags: USDJPY

Recent Posts

Geopolitics will destroy the euro

•    EURUSD falls due to geopolitics and expectations of tariff removal •    Gold returns to…

6 hours ago

Platinum Wave Analysis – 8 January 2026

Platinum: ⬇️ Sell - Platinum reversed from pivotal resistance level 150.00 - Likely to fall to…

19 hours ago

Baidu Wave Analysis – 8 January 2026

Baidu: ⬇️ Sell - Baidu reversed from resistance zone - Likely to fall to support level…

19 hours ago

EURUSD Wave Analysis – 8 January 2026

EURUSD: ⬇️ Sell - EURUSD broke daily up channel - Likely to fall to support…

21 hours ago

WTI crude oil Wave Analysis – 8 January 2026

WTI crude oil: ⬆️ Buy - WTI crude oil reversed from support zone - Likely…

21 hours ago

Do not underestimate dollar

Positive macro statistics for the US are helping the greenback. Gold could rise to $4,610…

1 day ago

This website uses cookies