Categories: Technical analysis

USDJPY Wave Analysis – 30 December, 2019

  • USDJPY reversed from resistance area
  • Likely to fall to 108.50

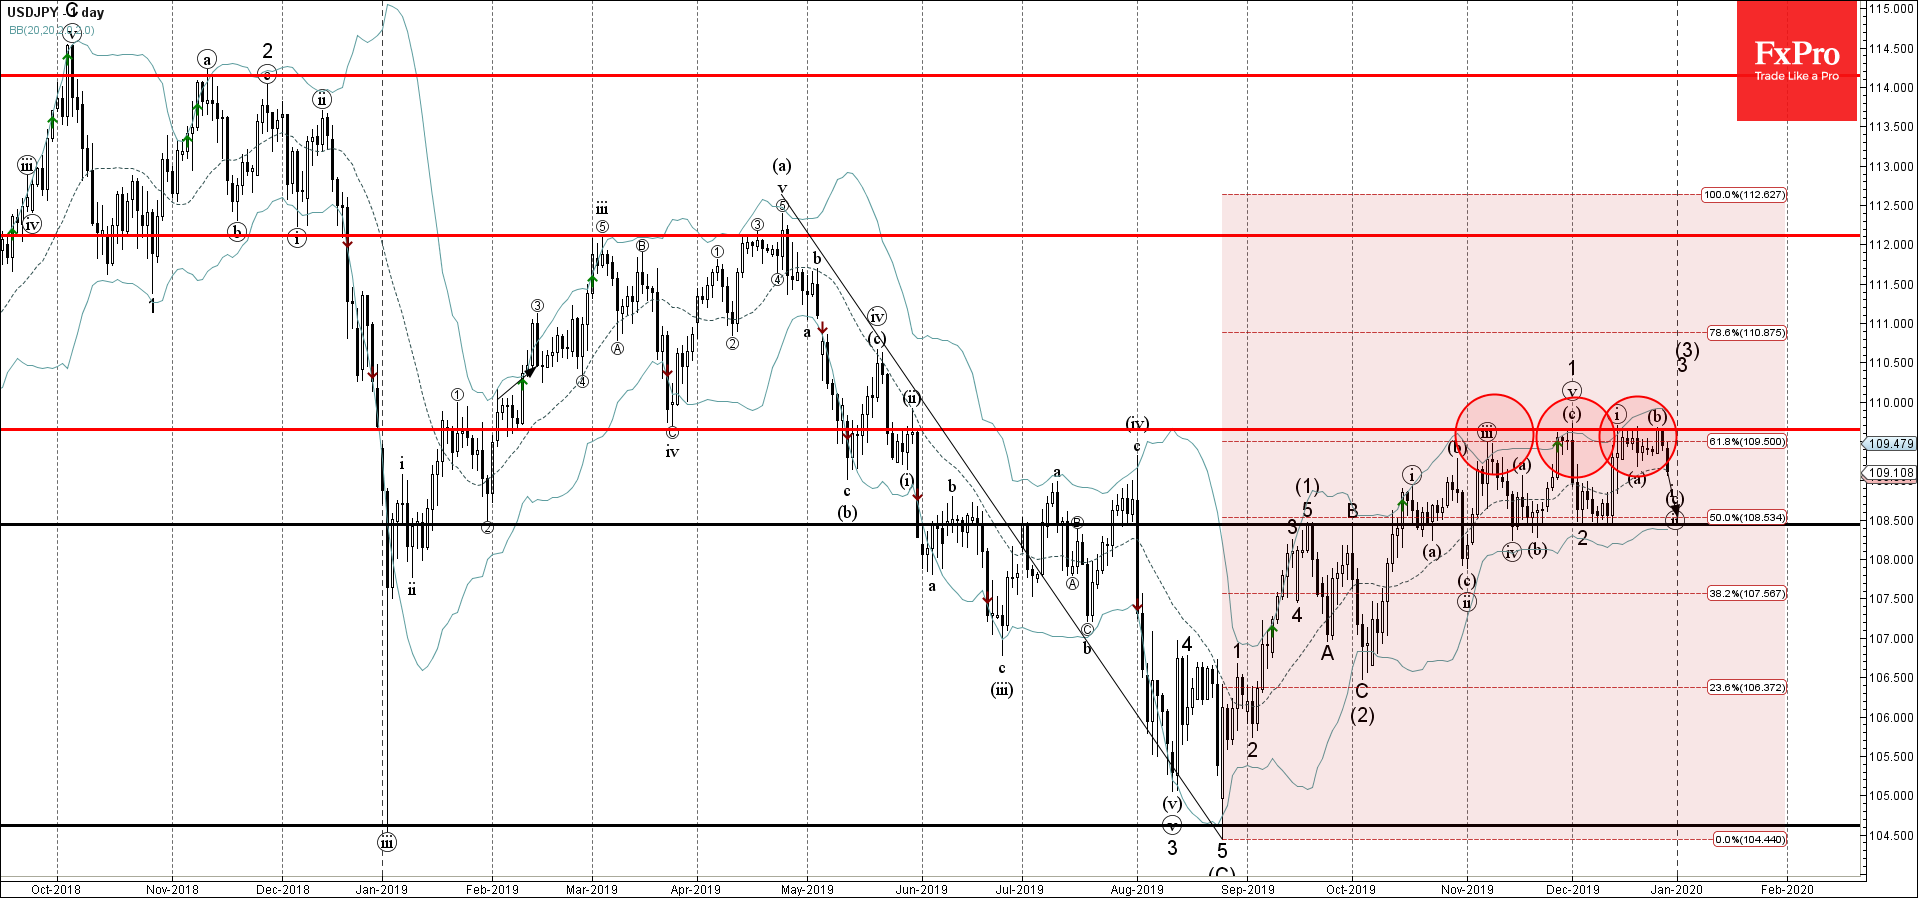
USDJPY recently reversed down from the resistance area lying between the resistance level 109.65 (which has been reversing the price from November), upper daily Bollinger Band and the 61.8% Fibonacci correction of the sharp downward impulse from April.

The downward reversal from this resistance area started the active short-term ABC correction (ii).

USDJPY is expected to fall further toward the next support level 108.50 (low of wave 2 and the target price for the completion of the active wave (iii)).

The FxPro Tech Analysis Team

The FxPro technical experts prepare a daily analysis of the most active currency pairs (majors, crosses, exotics) and commodities. Selected instruments are reviewed on daily trends (D1, H4), using the active Elliott Wave setups, Japanese candlesticks, indicators, and support/resistance levels.

Share
Published by
The FxPro Tech Analysis Team
Tags: USDJPY

Recent Posts

USDJPY Wave Analysis 26 April 2024

- USDJPY broke key resistance level 155.00 - Likely to rise to resistance level 160.00…

1 day ago

Ebay Wave Analysis 26 April 2024

- Ebay reversed from support level 49.35 - Likely to rise to resistance level 52.55…

1 day ago

False Alert with Yen Interventions?

Even though the Bank of Japan left the key rate and parameters of the QE…

2 days ago

Cooler Bitcoin

Market picture  Market Dynamics: The cryptocurrency market stabilised, losing just 0.1% of capitalisation and dropping to…

2 days ago

GBPCAD Wave Analysis 25 April 2024

- GBPCAD reversed from key support level 1.6910 - Likely to rise to resistance level…

3 days ago

GBPAUD Wave Analysis 25 April 2024

- GBPAUD reversed from support level 1.9135 - Likely to rise to resistance level 1.9360…

3 days ago

This website uses cookies