Categories: Technical analysis

Wheat Wave Analysis – 29 May, 2019

  • Wheat broke resistance zone
  • Further gains are likely

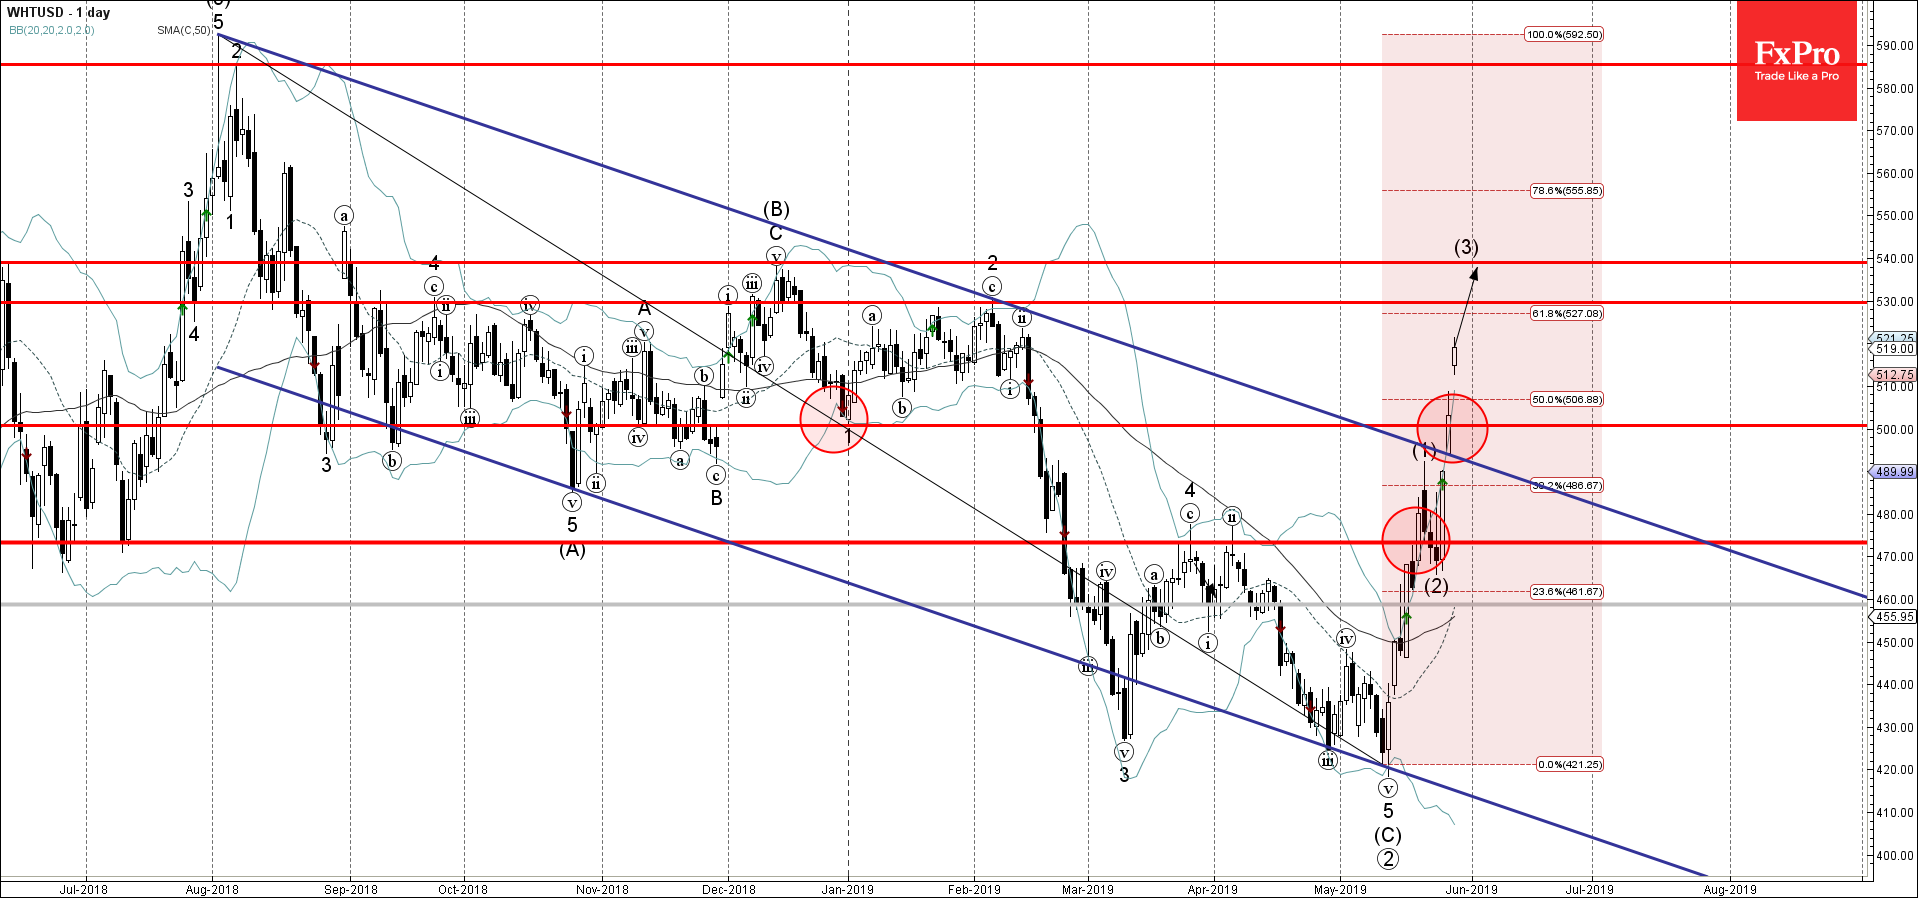
Wheat opened today with the runaway upward gap breaking through the resistance zone lying at the intersection of the resistance levels – 50% Fibonacci correction of the weekly downward impulse from last August and the round resistance level 500.00 (previous upward target).

The breakout of this resistance zone coincided with the breakout of the resistance trendline of the daily down channel from last August.

Wheat is expected to rise further inside the active medium-term impulse wave (3) and retest the next resistance levels 530.00 and 540.00.

The FxPro Tech Analysis Team

The FxPro technical experts prepare a daily analysis of the most active currency pairs (majors, crosses, exotics) and commodities. Selected instruments are reviewed on daily trends (D1, H4), using the active Elliott Wave setups, Japanese candlesticks, indicators, and support/resistance levels.

Share
Published by
The FxPro Tech Analysis Team
Tags: WHTUSD

Recent Posts

EURJPY Wave Analysis 2 May 2024

- EURJPY under strong bearish pressure - Likely to fall to support level 163.10 EURJPY…

10 hours ago

WTI crude oil Wave Analysis 2 May 2024

- WTI broke round support level 80.00 - Likely to fall to support level 76.00…

10 hours ago

ADP hints at another strong NFP on Friday

The monthly ADP labour market report showed that America created 192K new jobs in April, above…

2 days ago

Fed’s hawkish tone risks sinking S&P500 to 4700

Bears showed strength ahead of the FOMC decision.  U.S. indices sagged on Tuesday as investors…

2 days ago

A new stage of Bitcoin’s decline

Market Picture  Bitcoin's closing price on Tuesday became the lowest since late February, confirming the…

2 days ago

Ebay Wave Analysis 30 April 2024

- Ebay under the bearish pressure - Likely to fall to support level 51.00 Ebay…

2 days ago

This website uses cookies