Categories: Technical analysis

USDJPY Wave Analysis 26 October, 2020

• USDJPY reversed from support area

• Likely to rise to 105.50

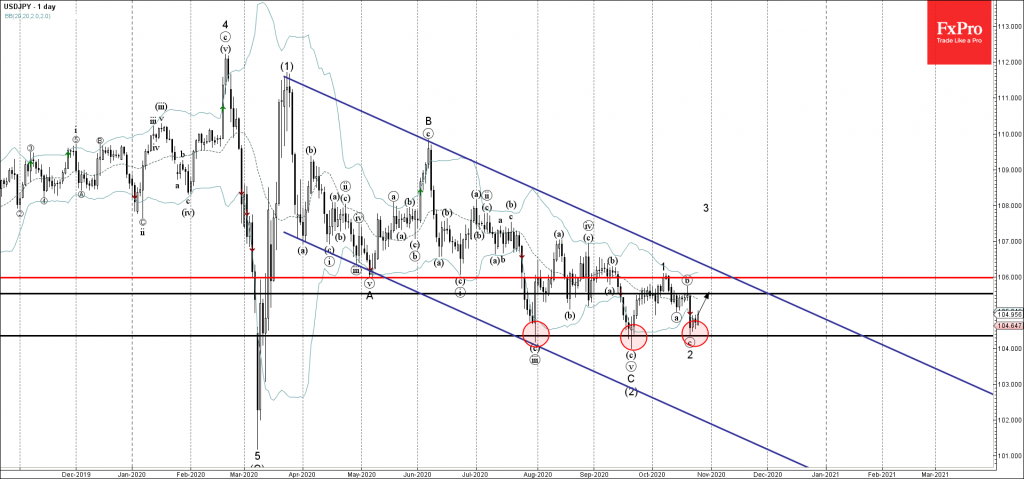
USDJPY continues to rise after the earlier upward reversal from the key support area lying between the powerful support level 104.35 (which has been steadily reversing the price from July) and the lower daily Bollinger band.

The upward reversal from this support area started the active short-term upward impulse wave 3 belonging to the impulse sequence (3) – which started in September from the same support level 104.35.

USDJPY is likely to rise further toward the next resistance level 105.50 (which started the previous minor impulse wave (c)).

The FxPro Tech Analysis Team

The FxPro technical experts prepare a daily analysis of the most active currency pairs (majors, crosses, exotics) and commodities. Selected instruments are reviewed on daily trends (D1, H4), using the active Elliott Wave setups, Japanese candlesticks, indicators, and support/resistance levels.

Share
Published by
The FxPro Tech Analysis Team
Tags: USDJPY

Recent Posts

USDJPY Wave Analysis 26 April 2024

- USDJPY broke key resistance level 155.00 - Likely to rise to resistance level 160.00…

2 days ago

Ebay Wave Analysis 26 April 2024

- Ebay reversed from support level 49.35 - Likely to rise to resistance level 52.55…

2 days ago

False Alert with Yen Interventions?

Even though the Bank of Japan left the key rate and parameters of the QE…

3 days ago

Cooler Bitcoin

Market picture  Market Dynamics: The cryptocurrency market stabilised, losing just 0.1% of capitalisation and dropping to…

3 days ago

GBPCAD Wave Analysis 25 April 2024

- GBPCAD reversed from key support level 1.6910 - Likely to rise to resistance level…

3 days ago

GBPAUD Wave Analysis 25 April 2024

- GBPAUD reversed from support level 1.9135 - Likely to rise to resistance level 1.9360…

3 days ago

This website uses cookies