Categories: Technical analysis

USDJPY Wave Analysis – 25 March, 2020

  • USDJPY rising inside impulse wave ③
  • Likely to reach 112.00 soon

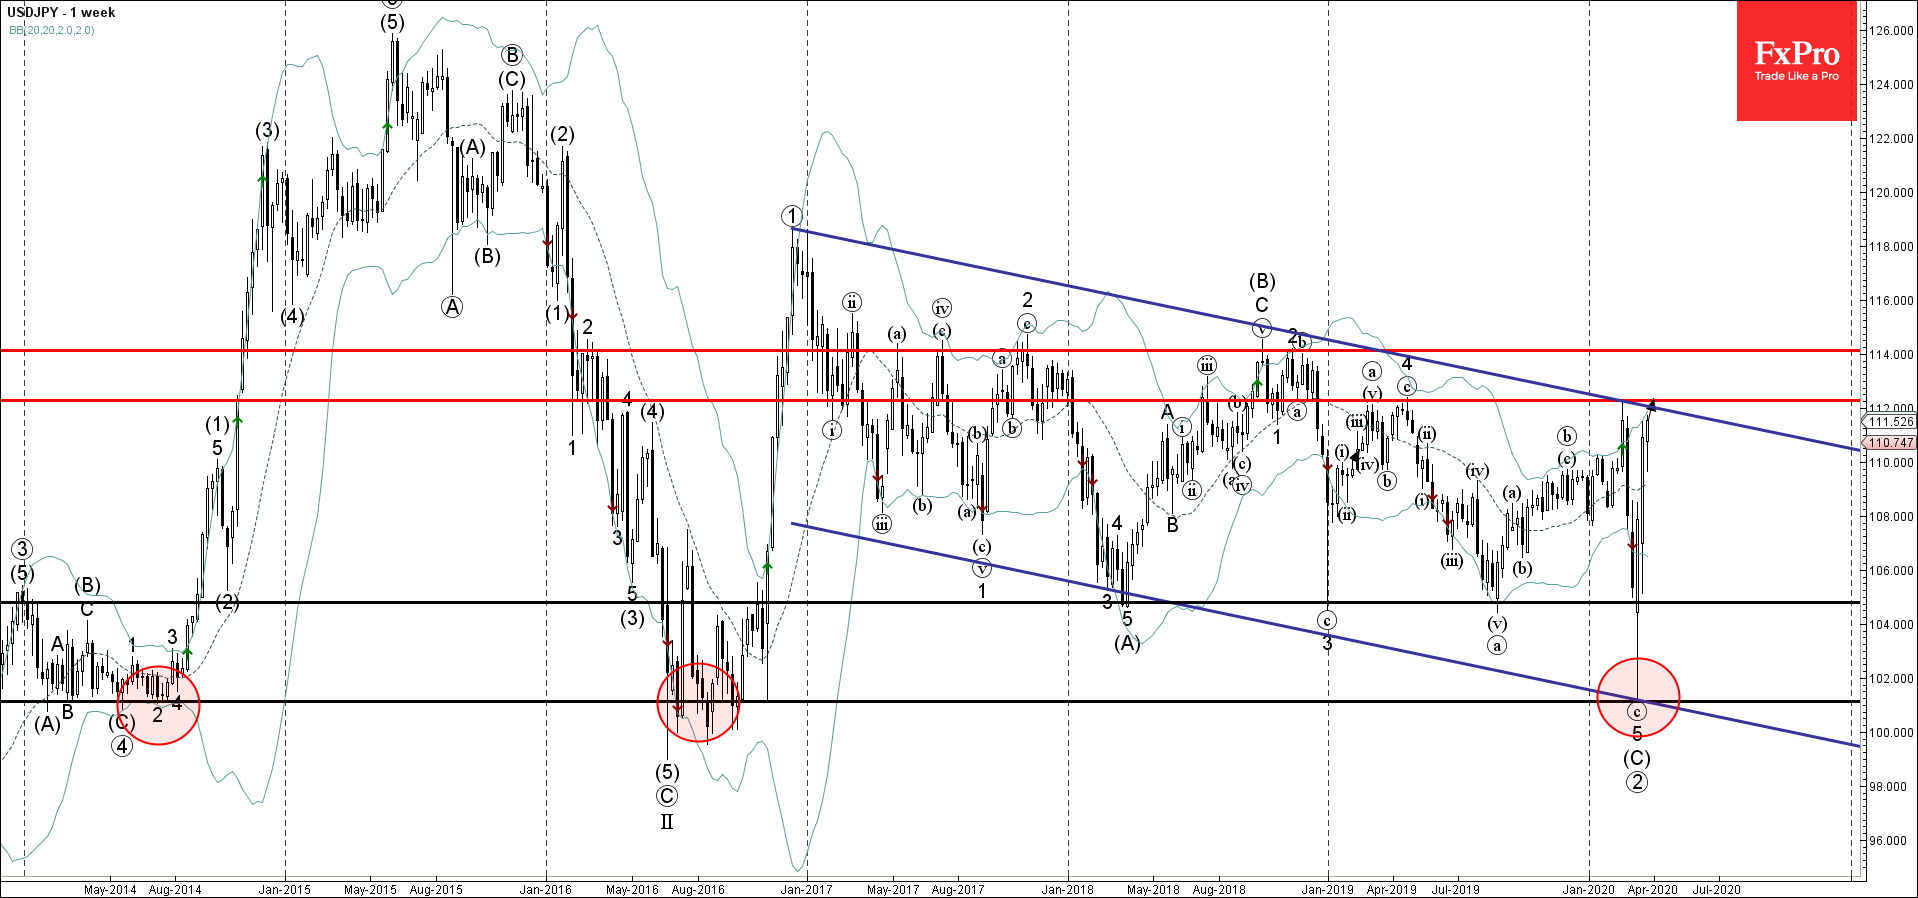
USDJPY continues to rise inside the sharp weekly upward impulse wave ③ – which started earlier from the powerful long-term support level 101.15, intersecting with the support trendline of the wide down channel from 2017.

The price is currently trading close to the key resistance level 112.00, intersecting with the upper resistance trendline of the aforementioned down channel.

Given the strength of the active weekly impulse wave ③  – USDJPY is likely test the resistance level 112.00 in the nearest time – the breakout of which can lead to further gains toward 114.00 (powerful resistance from 2018).

The FxPro Tech Analysis Team

The FxPro technical experts prepare a daily analysis of the most active currency pairs (majors, crosses, exotics) and commodities. Selected instruments are reviewed on daily trends (D1, H4), using the active Elliott Wave setups, Japanese candlesticks, indicators, and support/resistance levels.

Share
Published by
The FxPro Tech Analysis Team
Tags: USDJPY

Recent Posts

The dollar does not tolerate dissent

US GDP growth is driven not by the White House, but by AI. The Bank…

6 hours ago

The crypto market has made a breakthrough

The crypto market surges, hitting new highs, with bullish sentiment for Bitcoin and Ethereum amid…

6 hours ago

Brent Crude oil Wave Analysis – 13 January 2026

Brent Crude oil ⬆️ Buy - Brent Crude oil rising inside impulse wave c -…

20 hours ago

USDJPY Wave Analysis – 13 January 2026

USDJPY ⬆️ Buy - USDJPY broke resistance area - Likely to rise to resistance level…

20 hours ago

Exxon Mobil Wave Analysis – 13 January 2026

Exxon Mobil ⬆️ Buy - Exxon Mobil broke resistance level 125.60 - Likely to rise…

20 hours ago

BNB Wave Analysis – 13 January 2026

Brent Crude oil ⬆️ Buy - BNB broke out of sideways price range - Likely…

20 hours ago

This website uses cookies