Categories: Technical analysis

USDJPY Wave Analysis – 24 February 2025

– USDJPY reversed from the support area

– Likely to rise to the resistance level 150.95

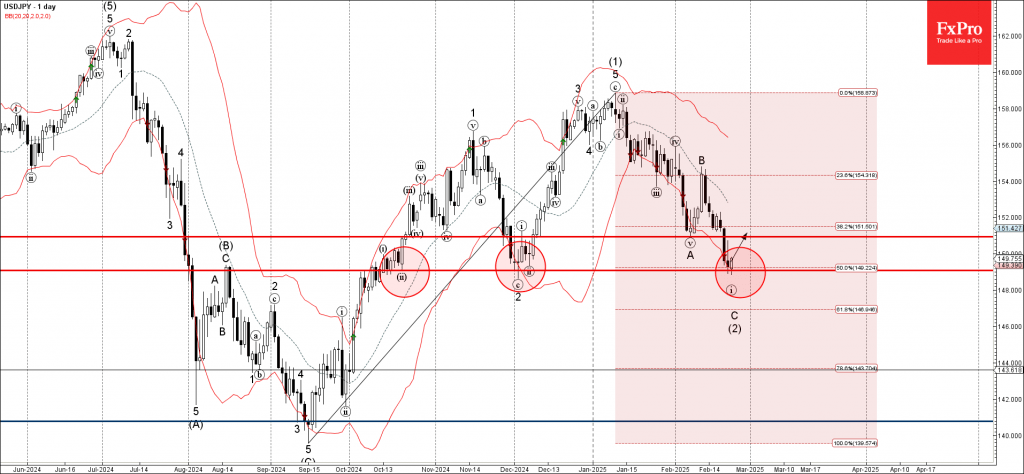
USDJPY currency pair previously reversed up from the support area set between the support level 149.00 (which has been reversing the price from October), 50% Fibonacci retracement of the upward impulse (1) from September and the lower daily Bollinger Band.

The upward reversal from this support area stopped the C-wave of the previous ABC correction (2) from the start of January.

Given the rising bearish yen sentiment seen across the FX markets today, USDJPY currency pair can be expected to rise to the next resistance level 150.95 (the former low of wave A from the start of February).

The FxPro Tech Analysis Team

The FxPro technical experts prepare a daily analysis of the most active currency pairs (majors, crosses, exotics) and commodities. Selected instruments are reviewed on daily trends (D1, H4), using the active Elliott Wave setups, Japanese candlesticks, indicators, and support/resistance levels.

Share
Published by
The FxPro Tech Analysis Team
Tags: USDJPY

Recent Posts

Solana Wave Analysis – 18 March 2025

Solana: ⬇️ Sell - Solana reversed from the resistance zone - Likely to fall to…

1 hour ago

CHFJPY Wave Analysis – 18 March 2025

CHFJPY: ⬆️ Buy - CHFJPY broke resistance zone - Likely to rise to resistance level…

1 hour ago

The crypto market is stuck in the mud

Market Picture The crypto market has been hovering in a narrow range for the past…

6 hours ago

FTSE 100 Wave Analysis – 17 March 2025

FTSE 100: ⬆️ Buy - FTSE 100 reversed from key support level 8425.00 - Likely…

22 hours ago

Alibaba Wave Analysis – 17 March 2025

Alibaba: ⬆️ Buy - Alibaba broke the key resistance level 145.00 - Likely to rise…

22 hours ago

EURNZD Wave Analysis – 17 March 2025

EURNZD: ⬇️ Sell - EURNZD reversed from long-term resistance level 1.9160 - Likely to fall…

1 day ago

This website uses cookies