Categories: Technical analysis

USDJPY Wave Analysis – 21 October, 2021

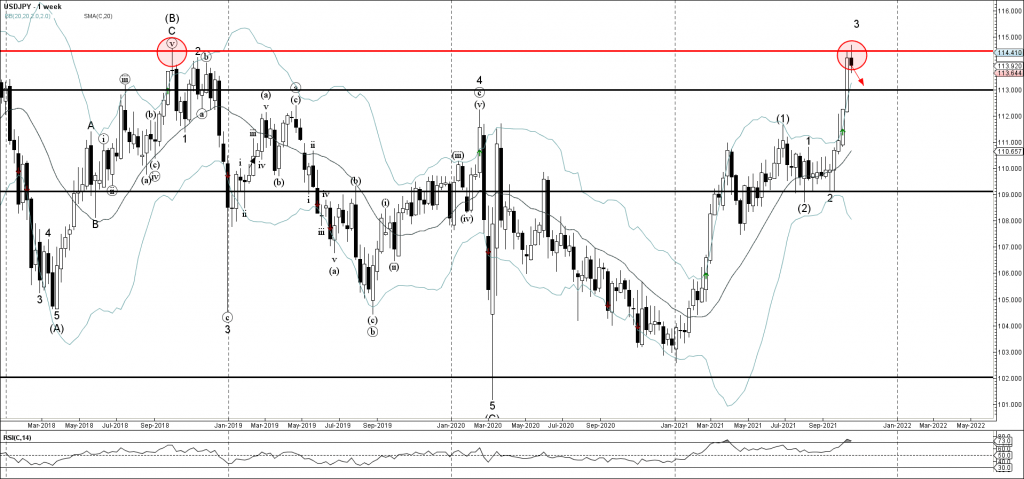
• USDJPY reversed from key resistance area

• Likely to fall to support level 113.00                                                                        


USDJPY currency pair continues to fall after the price reversed down from the major resistance area located between the multi-year resistance level 114.40 (which stopped the uptrend in 2018) and the upper weekly Bollinger Band.

The downward reversal from this resistance area stopped the previous sharp upward impulse wave 3.

Given the strength of the nearby resistance area and the overbought weekly RSI – USDJPY can be expected to fall further toward the next support level 113.00.

The FxPro Tech Analysis Team

The FxPro technical experts prepare a daily analysis of the most active currency pairs (majors, crosses, exotics) and commodities. Selected instruments are reviewed on daily trends (D1, H4), using the active Elliott Wave setups, Japanese candlesticks, indicators, and support/resistance levels.

Share
Published by
The FxPro Tech Analysis Team
Tags: USDJPY

Recent Posts

Amazon Wave Analysis 16 May 2024

- Amazon reversed from resistance level 190.00 - Likely to fall to support level 180.00…

6 hours ago

USDCHF Wave Analysis 16 May 2024

- USDCHF reversed from round support level 0.9000 - Likely to rise to resistance level…

6 hours ago

Crypto market shakes off consolidation

Market picture The release of US inflation data sparked a surge in risk asset purchases,…

17 hours ago

Gold Wave Analysis – 15 May, 2024

• Gold broke daily down channel • Likely to reach resistance level 2415.00 Gold recently…

1 day ago

AUDUSD Wave Analysis – 15 May, 2024

• AUDUSD broke key resistance level 0.6650 • Likely to reach resistance level 0.6760 AUDUSD…

1 day ago

EURUSD is trying to break the 5-month downtrend

The US dollar has been under relentless pressure since last Thursday, approaching more than one-month…

1 day ago

This website uses cookies