Categories: Technical analysis

USDJPY Wave Analysis 21 October, 2020

• USDJPY falling inside impulse wave C

• Likely to fall to 104.00

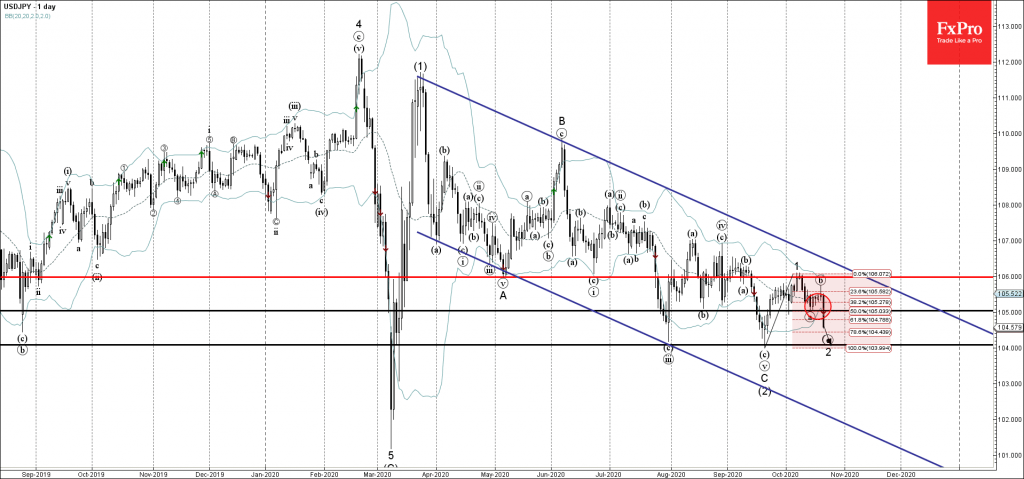
USDJPY continues to fall inside the short-term impulse wave (c), which previously broke the support level 105.00 intersecting with the 50% Fibonacci correction of the upward impulse wave 1 from September.              

The breakout of the support level 105.00 is aligned with the multi-month downtrend inside which the pair has been trading from March.

USDJPY is likely to fall further toward the next support level 104.00 (powerful support from September and the target price for the completion of the active ABC correction 2).

The FxPro Tech Analysis Team

The FxPro technical experts prepare a daily analysis of the most active currency pairs (majors, crosses, exotics) and commodities. Selected instruments are reviewed on daily trends (D1, H4), using the active Elliott Wave setups, Japanese candlesticks, indicators, and support/resistance levels.

Share
Published by
The FxPro Tech Analysis Team
Tags: USDJPY

Recent Posts

Adobe Wave Analysis 3 May 2024

- Adobe reversed from support zone - Likely to rise to resistance level 500.00 Adobe…

1 day ago

EURGBP Wave Analysis 3 May 2024

- EURJPY reversed from support zone - Likely to rise to resistance level 0.8625 EURGBP…

1 day ago

How Low Can the USDJPY Go?

USDJPY was slipping below 153 on Friday morning, a three-week low and having lost over…

2 days ago

Bitcoin’s Downtrend, Solana and Ethereum Form Double Bottom

Market picture  Crypto market capitalisation rose 3.3% in 24 hours to $2.22 trillion. Local capitalisation…

2 days ago

EURJPY Wave Analysis 2 May 2024

- EURJPY under strong bearish pressure - Likely to fall to support level 163.10 EURJPY…

2 days ago

WTI crude oil Wave Analysis 2 May 2024

- WTI broke round support level 80.00 - Likely to fall to support level 76.00…

2 days ago

This website uses cookies