Categories: Technical analysis

USDJPY Wave Analysis – 20 May, 2020

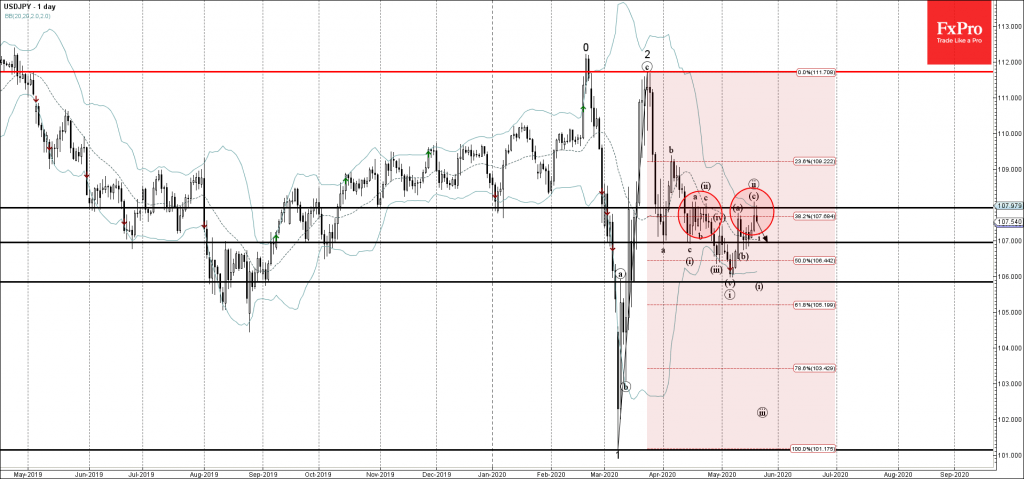
• USDJPY reversed from resistance zone

• Likely to fall to 107.00

USDJPY recently reversed down from the resistance zone lying between the key resistance level 107.90 (which has been reversing the price forms April), upper daily Bollinger Band and the 38.2% Fibonacci correction of the previous upward correction 2 from the start of March.

The downward reversal from this resistance zone started the active short-term impulse wave (iii). USDJPY is likely to fall further toward the next support level 107.00 (low of the previous minor correction (b)).

The FxPro Tech Analysis Team

The FxPro technical experts prepare a daily analysis of the most active currency pairs (majors, crosses, exotics) and commodities. Selected instruments are reviewed on daily trends (D1, H4), using the active Elliott Wave setups, Japanese candlesticks, indicators, and support/resistance levels.

Share
Published by
The FxPro Tech Analysis Team
Tags: USDJPY

Recent Posts

Pro News Weekly: Dollar Leads as Stocks Wobble

Welcome to Pro News Weekly! Here’s what is driving the markets this week: 💵 The…

24 hours ago

Strong macro data and rate spreads are the USD’s main weapon

Strong US macro data and wide rate spreads boost the dollar, pressuring EURUSD and gold;…

1 day ago

Top 10 Forex Trading Strategies

We have outlined the 10 best forex trading strategies with clear logic, real-world context, and…

1 day ago

Bitcoin has not crossed the correction line

Bitcoin holds near $95.5K as the market steadies but hasn't confirmed a exit from correction…

1 day ago

CHFJPY Wave Analysis – 15 January 2026

CHFJPY: ⬇️ Sell - CHFJPY reversed from resistance zone - Likely to fall to support level…

2 days ago

WTI Crude Oil Wave Analysis – 15 January 2026

WTI Crude Oil: ⬇️ Sell - WTI Crude Oil rising inside minor impulse wave (1) -…

2 days ago

This website uses cookies