Categories: Technical analysis

USDJPY Wave Analysis 20 June 2024

– USDJPY broke strong resistance level 157.65

– Likely to rise to resistance level 160.00

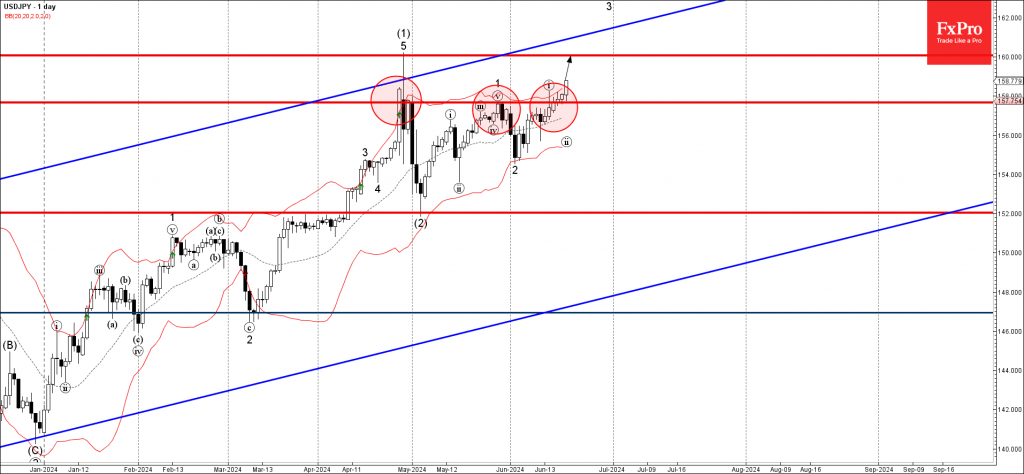
USDJPY currency pair recently broke above the strong resistance level 157.65 (which has been steadily reversing the price from the end of April, as you can see below).

The breakout of the resistance level 157.65 continues the clear uptrend that can be seen on the daily and the weekly USDJPY charts.

USDJPY currency pair can be expected to rise further to the next resistance level 160.00, which stopped the previous impulse wave (1) at the end of April.

The FxPro Tech Analysis Team

The FxPro technical experts prepare a daily analysis of the most active currency pairs (majors, crosses, exotics) and commodities. Selected instruments are reviewed on daily trends (D1, H4), using the active Elliott Wave setups, Japanese candlesticks, indicators, and support/resistance levels.

Share
Published by
The FxPro Tech Analysis Team
Tags: USDJPY

Recent Posts

EBAY Wave Analysis 2 July 2024

- EBAY reversed from support level 52.00 - Likely to rise to resistance level 54.60…

35 mins ago

CADJPY Wave Analysis 2 July 2024

- CADJPY broke key resistance level 117.00 - Likely to reach resistance level 119.00 CADJPY…

36 mins ago

Eurozone: Inflation Deceleration Stalled

According to the Eurostat Flash estimate, the euro area CPI stood at 2.5% y/y, hovering…

6 hours ago

Dollar Rises on Other Currencies’ Problems

The US dollar has been settling near two-month highs since late last week, but this…

8 hours ago

Stocks Held Back Crypto Gains

Market picture The crypto market retreated by 0.6% in 24 hours to a total cap…

11 hours ago

AUDUSD Wave Analysis 1 July 2024

- AUDUSD reversed from strong resistance zone - Likely to fall to support level 0.6620…

23 hours ago

This website uses cookies