Categories: Technical analysis

USDJPY Wave Analysis 2 September 2024

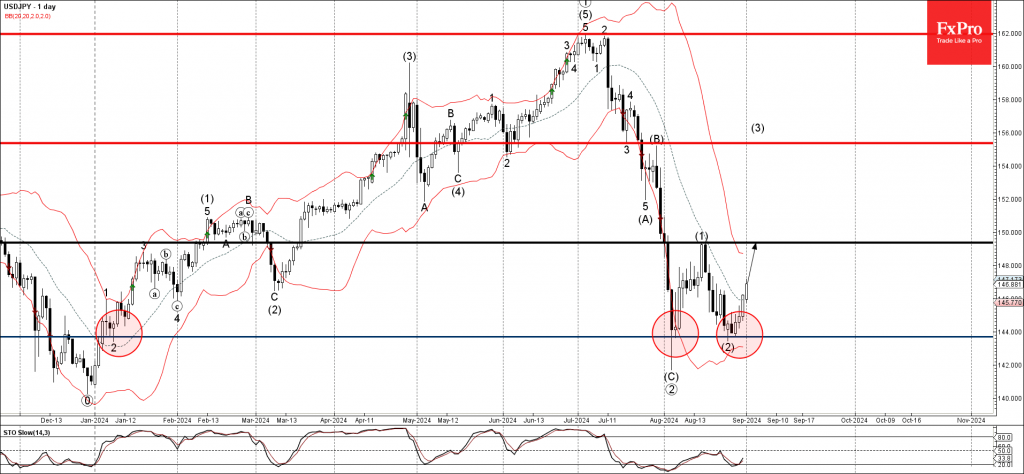
– USDJPY reversed from support level 144.00

– Likely to rise to resistance level 149.35

USDJPY currency pair recently reversed up from the strong support level 144.00 (which has been reversing the price from January) standing near the lower daily Bollinger Band.

The upward reversal from the support level 144.00 created the daily Japanese candlesticks reversal pattern Bullish Engulfing – which started the active impulse wave (3).

Given the strength of the support level 144.00 and the continuation of the yen sales, USDJPY currency pair can then be expected to rise to the next resistance level 149.35 (top of the previous impulse wave (1)).

The FxPro Tech Analysis Team

The FxPro technical experts prepare a daily analysis of the most active currency pairs (majors, crosses, exotics) and commodities. Selected instruments are reviewed on daily trends (D1, H4), using the active Elliott Wave setups, Japanese candlesticks, indicators, and support/resistance levels.

Share
Published by
The FxPro Tech Analysis Team
Tags: USDJPY

Recent Posts

Gold Wave Analysis 19 September 2024

- Gold reversed from support level 2550.00 - Likely to rise to resistance level 2600.00…

28 mins ago

S&P 500 Wave Analysis 19 September 2024

- S&P 500 broke key resistance level 5670.00 - Likely to rise to resistance level…

28 mins ago

The Fed’s big rate and projections cut

The Fed cut the rate by 50 bps, This change was not fully factored into…

7 hours ago

Crypto market climbs out of the pit

The crypto market as a whole and Bitcoin hit three-week highs, but are still in…

13 hours ago

AUDCAD Wave Analysis 18 September 2024

- AUDCAD broke pivotal resistance level 0.9170 - Likely to rise to resistance level 0.9260…

1 day ago

WTI Wave Analysis 18 September 2024

- WTI reversed from round resistance level 70.00 - Likely to fall to support level…

1 day ago

This website uses cookies