Categories: Technical analysis

USDJPY Wave Analysis – 17 November, 2021

• USDJPY reversed from resistance area

• Likely to fall to support level 114.00.                                                                       


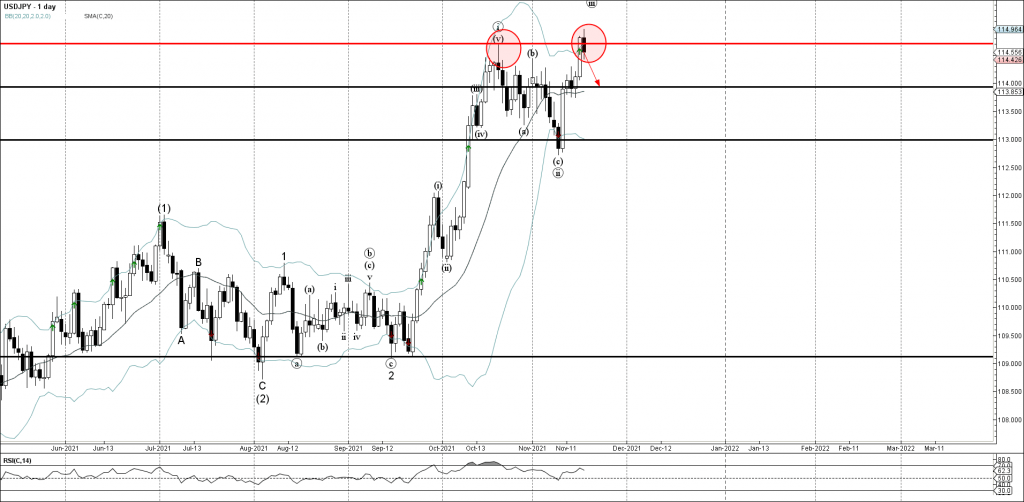
USDJPY currency pair recently reversed down from the major resistance area located between the key resistance level 114.70 (previous monthly high from October) and the upper daily Bollinger Band.

The downward reversal from this resistance area stopped the previous short-term impulse wave (iii) of the higher order impulse waves 3 and (3).

Given the strength of the aforementioned resistance area, USDJPY currency pair can be expected to fall further toward the next support level 114.00.

The FxPro Tech Analysis Team

The FxPro technical experts prepare a daily analysis of the most active currency pairs (majors, crosses, exotics) and commodities. Selected instruments are reviewed on daily trends (D1, H4), using the active Elliott Wave setups, Japanese candlesticks, indicators, and support/resistance levels.

Share
Published by
The FxPro Tech Analysis Team
Tags: USDJPY

Recent Posts

FTSE 100 Wave Analysis – 17 March 2025

FTSE 100: ⬆️ Buy - FTSE 100 reversed from key support level 8425.00 - Likely…

1 hour ago

Alibaba Wave Analysis – 17 March 2025

Alibaba: ⬆️ Buy - Alibaba broke the key resistance level 145.00 - Likely to rise…

1 hour ago

EURNZD Wave Analysis – 17 March 2025

EURNZD: ⬇️ Sell - EURNZD reversed from long-term resistance level 1.9160 - Likely to fall…

5 hours ago

AUDUSD Wave Analysis – 17 March 2025

AUDUSD: ⬆️ Buy - AUDUSD broke resistance level 0.6350 - Likely to rise to resistance…

5 hours ago

Weak US retail sales might boost stocks

Weak US retail sales are adding to concerns of a potential recession, putting pressure on…

8 hours ago

Dow Jones: Rebound or Rally? The Fed Holds the Key

The Dow Jones rebound depends on the Federal Reserve's monetary policy and incoming data. It…

9 hours ago

This website uses cookies