Categories: Technical analysis

USDJPY Wave Analysis 17 November, 2020

• USDJPY reversed from resistance area

• Likely to fall to 103.25

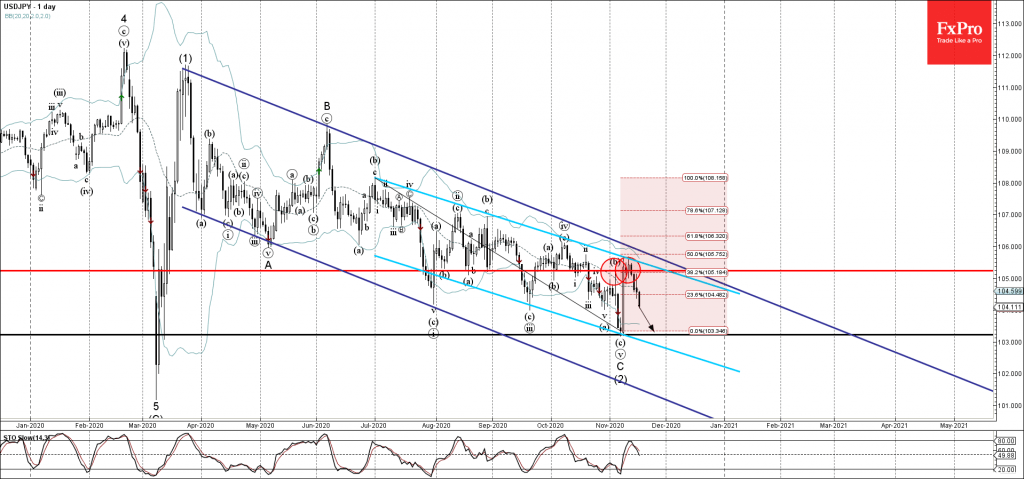
USDJPY continues to fall after previously reversing down from the resistance area lying between the resistance level 105.20 (former support from the start of October), upper daily Bollinger Band and the 38.2% Fibonacci correction of the downward impulse from June.

This resistance area was further strengthened by the resistance trendlines of the two daily down channels from July and March respectively.

USDJPY is likely to fall further toward the next support level 103.25 (which stopped the previous sharp impulse wave C at the start of November).

The FxPro Tech Analysis Team

The FxPro technical experts prepare a daily analysis of the most active currency pairs (majors, crosses, exotics) and commodities. Selected instruments are reviewed on daily trends (D1, H4), using the active Elliott Wave setups, Japanese candlesticks, indicators, and support/resistance levels.

Share
Published by
The FxPro Tech Analysis Team
Tags: USDJPY

Recent Posts

USDJPY Wave Analysis 26 April 2024

- USDJPY broke key resistance level 155.00 - Likely to rise to resistance level 160.00…

12 hours ago

Ebay Wave Analysis 26 April 2024

- Ebay reversed from support level 49.35 - Likely to rise to resistance level 52.55…

12 hours ago

False Alert with Yen Interventions?

Even though the Bank of Japan left the key rate and parameters of the QE…

20 hours ago

Cooler Bitcoin

Market picture  Market Dynamics: The cryptocurrency market stabilised, losing just 0.1% of capitalisation and dropping to…

24 hours ago

GBPCAD Wave Analysis 25 April 2024

- GBPCAD reversed from key support level 1.6910 - Likely to rise to resistance level…

2 days ago

GBPAUD Wave Analysis 25 April 2024

- GBPAUD reversed from support level 1.9135 - Likely to rise to resistance level 1.9360…

2 days ago

This website uses cookies