Categories: Technical analysis

USDJPY Wave Analysis – 16 June 2025

USDJPY: ⬆️ Buy

– USDJPY reversed from the support zone

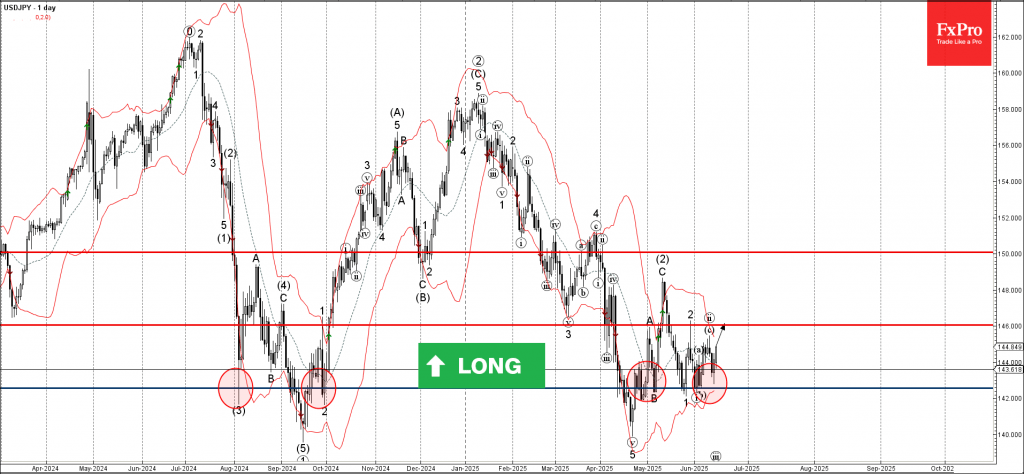
– Likely to rise to the resistance level 146.00

USDJPY currency pair recently reversed from the support zone surrounding the pivotal support level 142.50, which has been reversing the price from the start of August.

The upward reversal from the support level 142.50 created the daily Japanese candlesticks reversal pattern Piercing Line.

USDJPY currency pair can be expected to rise to the next resistance level 146.00 (top of the previous correction 2 from last month).

The FxPro Tech Analysis Team

The FxPro technical experts prepare a daily analysis of the most active currency pairs (majors, crosses, exotics) and commodities. Selected instruments are reviewed on daily trends (D1, H4), using the active Elliott Wave setups, Japanese candlesticks, indicators, and support/resistance levels.

Share
Published by
The FxPro Tech Analysis Team
Tags: USDJPY

Recent Posts

NZDCAD Wave Analysis – 7 January 2026

NZDCAD: ⬆️ Buy - NZDCAD reversed from support zone - Likely to rise to resistance…

9 hours ago

Bitcoin Wave Analysis – 7 January 2026

Bitcoin: ⬇️ Sell - Bitcoin reversed from resistance zone - Likely to fall to support…

9 hours ago

EURGBP Wave Analysis – 7 January 2026

EURGBP: ⬆️ Buy - EURGBP reversed from support zone - Likely to rise to resistance…

9 hours ago

Brent Crude Oil Wave Analysis – 7 January 2026

Brent Crude Oil: ⬇️ Sell - Brent Crude Oil reversed from resistance zone - Likely…

9 hours ago

Old fears about the euro have returned

The resurgence of the political crisis in France is weighing on EURUSD The US dollar…

19 hours ago

The crypto market has hit the upper limit of its rebound

The crypto market faces resistance at $3.2T; sentiment rises, but selling pressure persists. Bitcoin and…

21 hours ago

This website uses cookies