Technical analysis

USDJPY Wave Analysis – 13 January 2026

USDJPY ⬆️ Buy

– USDJPY broke resistance area

– Likely to rise to resistance level 160.00

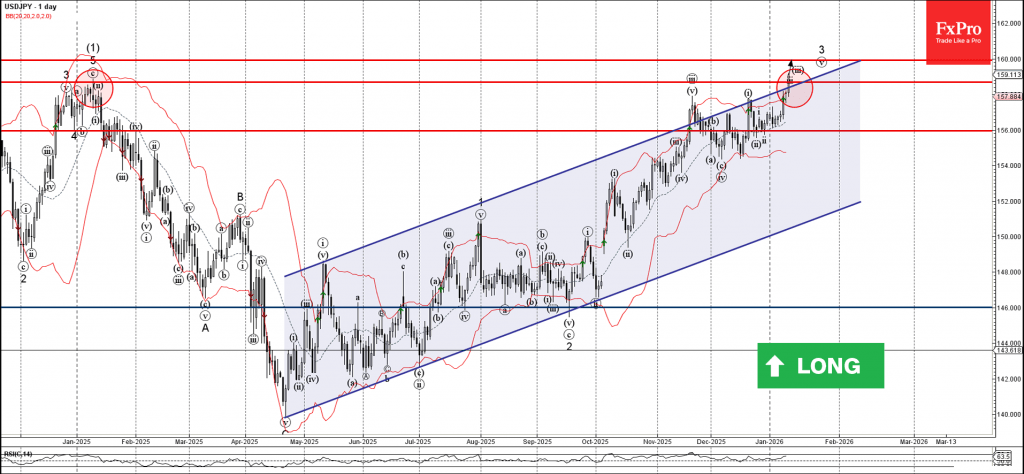
USDJPY currency pair recently broke the resistance area between the long-term resistance level 158.70 (which started the sharp downtrend in January) and the resistance trendline of the weekly up channel from April.

The breakout of this resistance area accelerated the active impulse waves v and 3 – which belong to the extended impulse wave (3) from April.

Given the clear daily uptrend, USDJPY currency pair can be expected to rise to the next resistance level 160.00 (target for the completion of the active impulse waves v and 3).

The FxPro Tech Analysis Team

The FxPro technical experts prepare a daily analysis of the most active currency pairs (majors, crosses, exotics) and commodities. Selected instruments are reviewed on daily trends (D1, H4), using the active Elliott Wave setups, Japanese candlesticks, indicators, and support/resistance levels.

Share
Published by
The FxPro Tech Analysis Team
Tags: USDJPY

Recent Posts

Brent Crude oil Wave Analysis – 13 January 2026

Brent Crude oil ⬆️ Buy - Brent Crude oil rising inside impulse wave c -…

2 hours ago

Exxon Mobil Wave Analysis – 13 January 2026

Exxon Mobil ⬆️ Buy - Exxon Mobil broke resistance level 125.60 - Likely to rise…

2 hours ago

BNB Wave Analysis – 13 January 2026

Brent Crude oil ⬆️ Buy - BNB broke out of sideways price range - Likely…

2 hours ago

A slightly weaker CPI was not enough to break through the highs

US CPI data a bit softer than forecasts, sparking brief market optimism, but resistance remains.…

7 hours ago

Pro News Flash: Global Tensions Fuel a Fresh Oil Rally

🛢️ Oil prices are finding fresh strength as geopolitical tensions in the Middle East reignite…

8 hours ago

Crude Oil counteracts

Middle East tensions and Venezuelan supply shifts drive Brent crude volatility, with geopolitical risks and…

11 hours ago

This website uses cookies