Categories: Technical analysis

USDJPY Wave Analysis – 09 May, 2019

  • USDJPY broke key support level 109.70
  • Further losses are likely

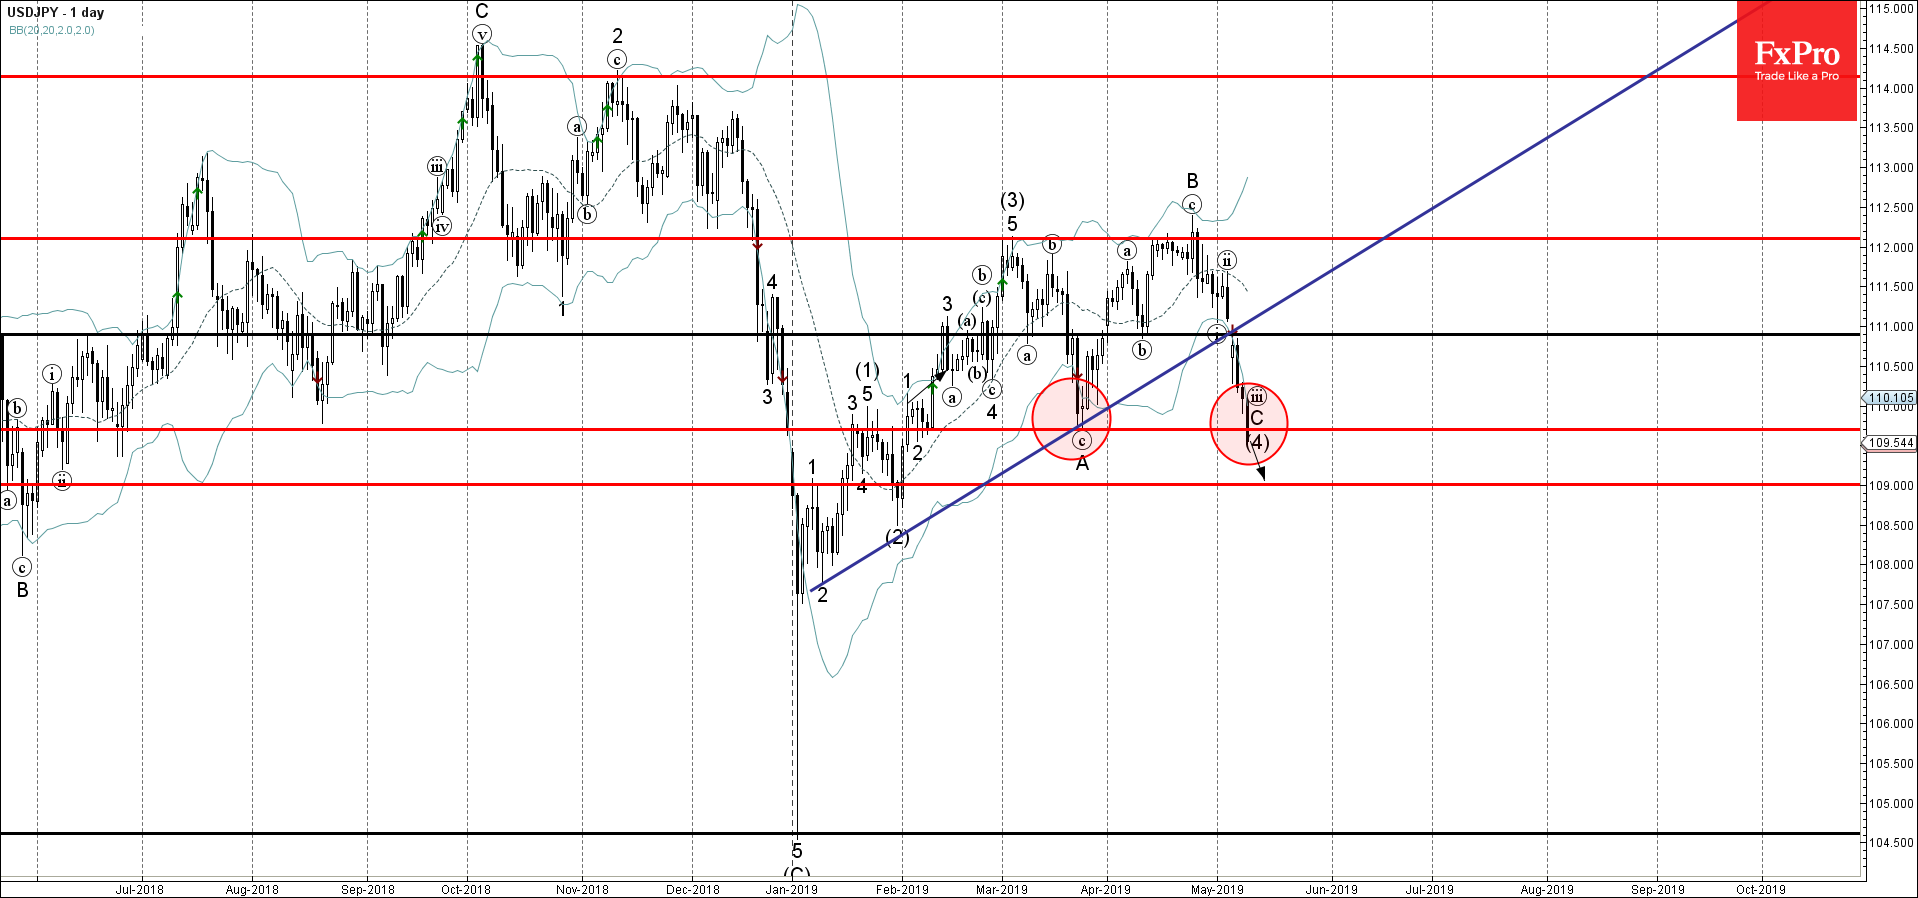
USDJPY continues to fall after the earlier breakout of the key support level 109.70 (monthly low from March) – which was preceded by the breakout of the support trendline from January.

The breakout of the support level 109.70 is likely to strengthen the bearish pressure on this currency pair.

USDJPY is expected to fall further inside the active medium-term ABC correction (4) toward the next support level 109.00.

The FxPro Tech Analysis Team

The FxPro technical experts prepare a daily analysis of the most active currency pairs (majors, crosses, exotics) and commodities. Selected instruments are reviewed on daily trends (D1, H4), using the active Elliott Wave setups, Japanese candlesticks, indicators, and support/resistance levels.

Share
Published by
The FxPro Tech Analysis Team
Tags: USDJPY

Recent Posts

FTSE 100 Wave Analysis – 17 March 2025

FTSE 100: ⬆️ Buy - FTSE 100 reversed from key support level 8425.00 - Likely…

9 hours ago

Alibaba Wave Analysis – 17 March 2025

Alibaba: ⬆️ Buy - Alibaba broke the key resistance level 145.00 - Likely to rise…

9 hours ago

EURNZD Wave Analysis – 17 March 2025

EURNZD: ⬇️ Sell - EURNZD reversed from long-term resistance level 1.9160 - Likely to fall…

13 hours ago

AUDUSD Wave Analysis – 17 March 2025

AUDUSD: ⬆️ Buy - AUDUSD broke resistance level 0.6350 - Likely to rise to resistance…

13 hours ago

Weak US retail sales might boost stocks

Weak US retail sales are adding to concerns of a potential recession, putting pressure on…

16 hours ago

Dow Jones: Rebound or Rally? The Fed Holds the Key

The Dow Jones rebound depends on the Federal Reserve's monetary policy and incoming data. It…

17 hours ago

This website uses cookies