Categories: Technical analysis

USDJPY falling inside impulse wave ③

  • USDJPY falling inside impulse wave ③
  • Further losses are likely

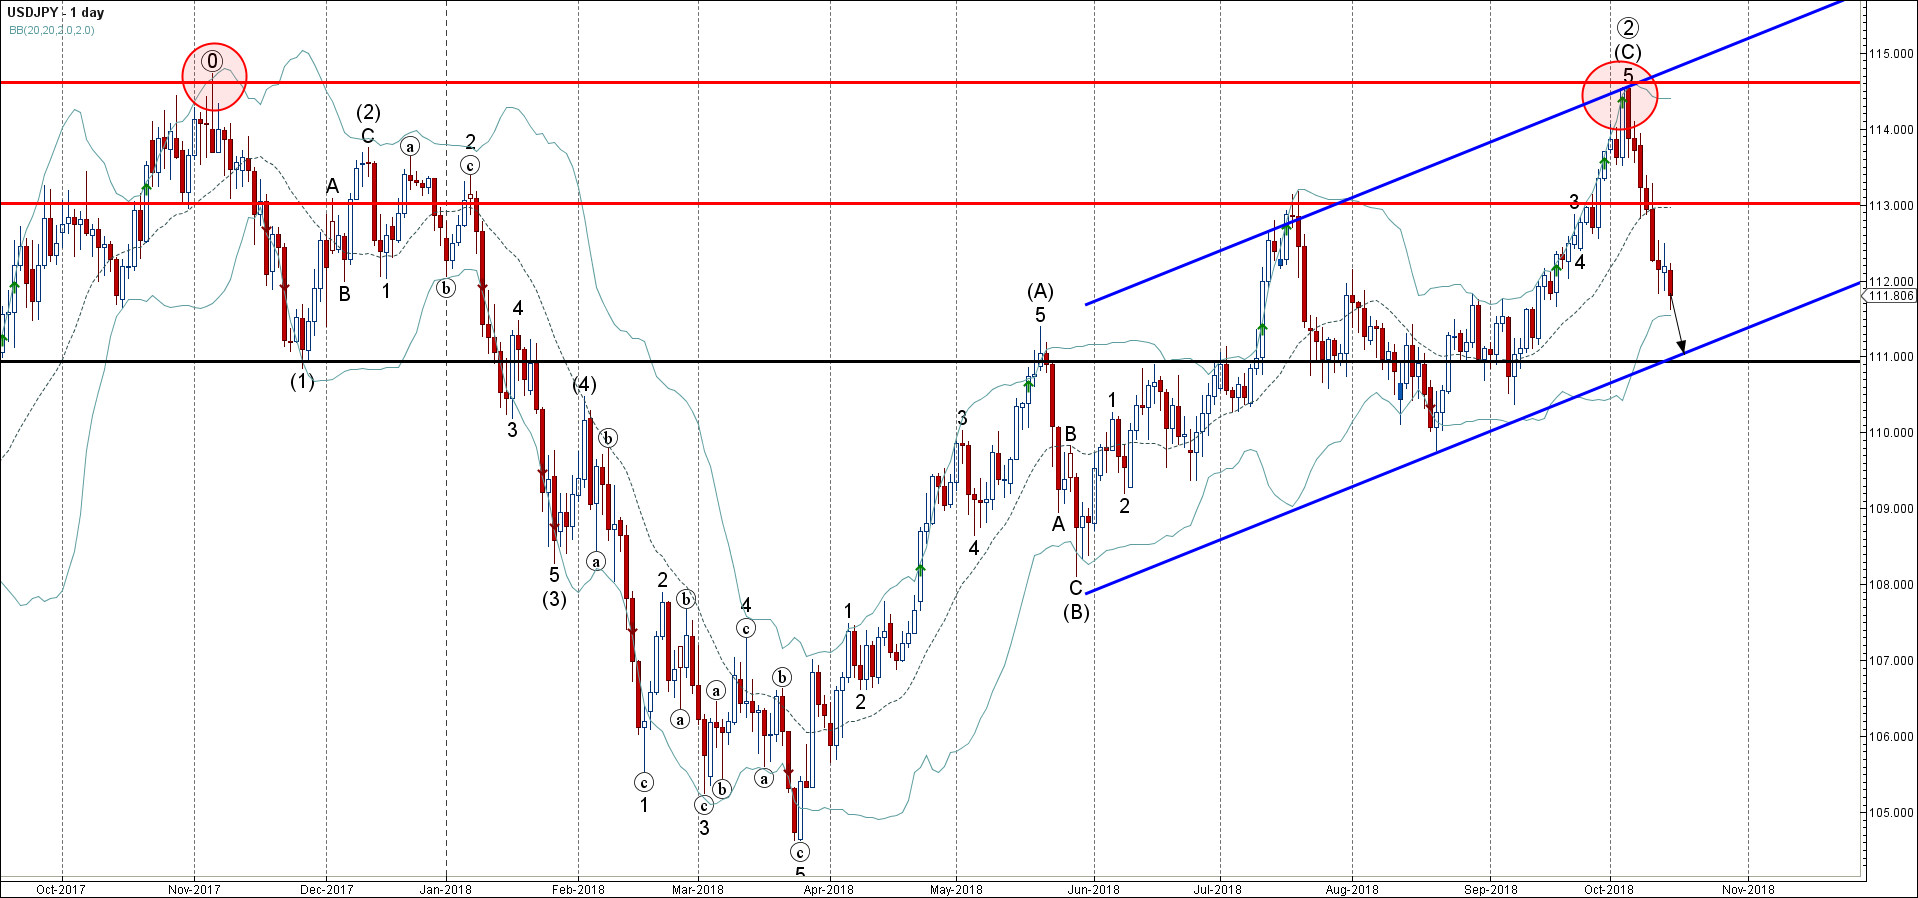
USDJPY continues to fall impulse the sharp primary impulse wave ③, which started earlier from the powerful resistance area lying between the long-term resistance level 114.60, upper daily Bollinger Band and the resistance level trendline of the daily up channel from May.

The downward reversal from the aforementioned resistance area created the strong weekly Japanese candlestick reversal pattern Evening Star Doji.

USDJPY is expected to fall further and re-test the next support level 111.00, intersecting with the support trendline of the daily up channel from May.

AddThis Website Tools
The FxPro Tech Analysis Team

The FxPro technical experts prepare a daily analysis of the most active currency pairs (majors, crosses, exotics) and commodities. Selected instruments are reviewed on daily trends (D1, H4), using the active Elliott Wave setups, Japanese candlesticks, indicators, and support/resistance levels.

Share
Published by
The FxPro Tech Analysis Team
Tags: USDJPY

Recent Posts

Pfizer Wave Analysis – 27 March 2025

Pfizer: ⬇️ Sell - Pfizer broke support level 25.20 - Likely to fall to support level…

1 hour ago

Silver Wave Analysis – 27 March 2025

Silver: ⬆️ Buy - Silver broke resistance area - Likely to rise to resistance level…

1 hour ago

EURGBP Wave Analysis – 27 March 2025

EURGBP: ⬇️ Sell - EURGBP broke support area - Likely to fall to support level…

5 hours ago

3M Wave Analysis – 27 March 2025

3M: ⬇️ Sell - 3M reversed from resistance area - Likely to fall to support…

5 hours ago

Smashed Hopes for US Stocks Recovery

The US stock market faced resistance from new auto tariffs and concerns about global response,…

8 hours ago

Gold and Silver about to break the ceiling

Gold has experienced growth, reaching historical highs due to new tariff wars. Silver has also…

10 hours ago