Categories: Technical analysis

USDCHF Wave Analysis – 8 June 2023

– USDCHF reversed from pivotal resistance level 0.9100

– Likely to fall to support level 0.8940

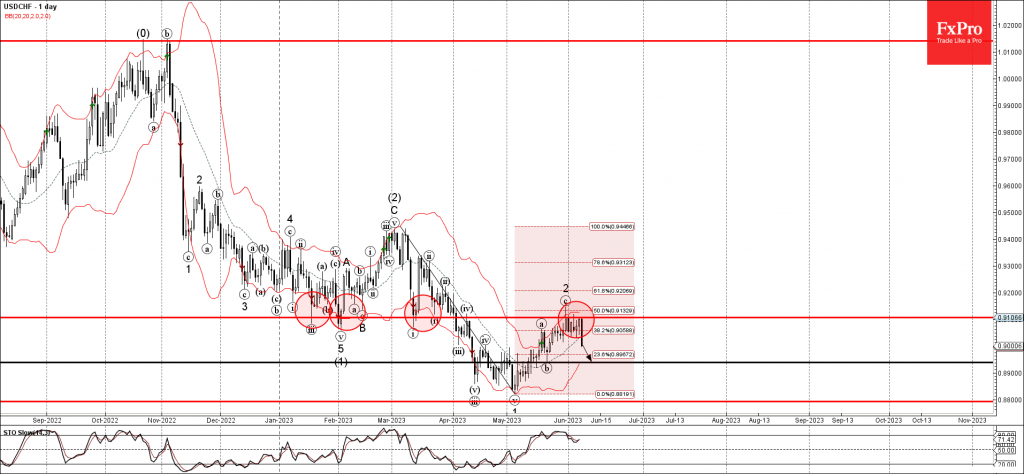
USDCHF recently reversed down sharply from the pivotal resistance level 0.9100 (former strong support from January to March), coinciding with the upper daily Bollinger Band.

The downward reversal from the resistance level 0.9100 continues the active short-term impulse wave 3, which belongs to wave (3) from the start of March.

Given the clear daily downtrend, USDCHF can be expected to fall further toward the next support level 0.8940 (low of the previous minor correction (b)).

AddThis Website Tools
The FxPro Tech Analysis Team

The FxPro technical experts prepare a daily analysis of the most active currency pairs (majors, crosses, exotics) and commodities. Selected instruments are reviewed on daily trends (D1, H4), using the active Elliott Wave setups, Japanese candlesticks, indicators, and support/resistance levels.

Share
Published by
The FxPro Tech Analysis Team
Tags: USDCHF

Recent Posts

AUDUSD Wave Analysis – 22 April 2025

AUDUSD: ⬇️ Sell - AUDUSD reversed from the key resistance level 0.6400 - Likely to…

27 seconds ago

Crypto Market Escapes from Fear

Market Overview The crypto market has gained around 2% over the past seven days, with…

12 hours ago

Nike Wave Analysis – 21 April 2025

Nike: ⬆️ Buy - Nike reversed from the long-term support level 52.60 - Likely to…

23 hours ago

Natural Gas Wave Analysis – 21 April 2025

Natural gas: ⬇️ Sell Natural gas broke support area Likely to fall to support level…

23 hours ago

EURUSD Wave Analysis – 21 April 2025

EURUSD: ⬆️ Buy - EURUSD broke the resistance area - Likely to test resistance level…

1 day ago

USDJPY Wave Analysis – 21 April 2025

USDJPY: ⬇️ Sell - USDJPY broke support area - Likely to fall to support level…

1 day ago