Categories: Technical analysis

USDCHF Wave Analysis 4 March, 2021

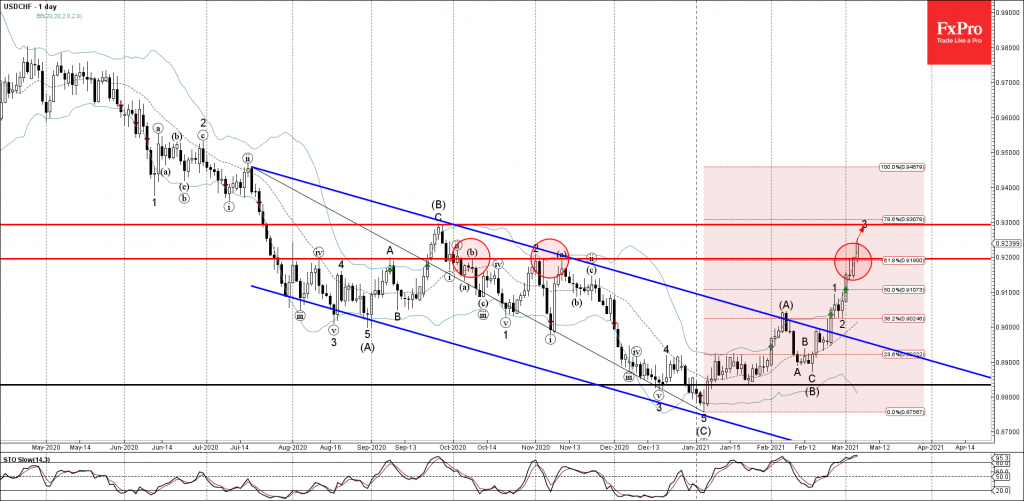
• USDCHF broke resistance area

• Likely to test resistance level 0.9300

USDCHF continues to rise steadily after the earlier breakout of the resistance area lying between the key resistance level 0.9200 (former monthly high from November) and the 61.8% Fibonacci correction level of the previous sharp impulse from July.

The breakout of this resistance area should accelerate the active minor impulse wave 3.

USDCHF is likely to rise further toward the next resistance level 0.9300 (former monthly high from September and the target for completion of wave 3).

The FxPro Tech Analysis Team

The FxPro technical experts prepare a daily analysis of the most active currency pairs (majors, crosses, exotics) and commodities. Selected instruments are reviewed on daily trends (D1, H4), using the active Elliott Wave setups, Japanese candlesticks, indicators, and support/resistance levels.

Share
Published by
The FxPro Tech Analysis Team
Tags: USDCHF

Recent Posts

Markets pick up signals from the White House

Donald Trump has no intention of dismissing Jerome Powell. The White House's decision to postpone…

41 minutes ago

Nat Gas Current situation #tradelikeapro #tradingshort #tradingtips #gas #tradingstrategy #trading

Today is Thursday, January 15th. Once again we will talk about the gas market. The…

1 hour ago

Bitcoin aims to break out of a corrective rebound

Crypto market rebounds, Bitcoin eyes $100K, Dash surges, institutional demand rises, and Ethereum staking hits…

1 hour ago

Bitcoin Wave Analysis – 14 January 2026

Bitcoin: ⬆️ Buy - Bitcoin broke resistance area - Likely to rise to resistance level…

16 hours ago

NZDJPY Wave Analysis – 14 January 2026

NZDJPY: ⬇️ Sell - NZDJPY reversed down from the resistance area - Likely to fall…

16 hours ago

What is Leverage?

Leverage is a mechanism that lets traders control larger positions using smaller capital. By choosing…

20 hours ago

This website uses cookies