Categories: Technical analysis

USDCHF Wave Analysis 30 September 2024

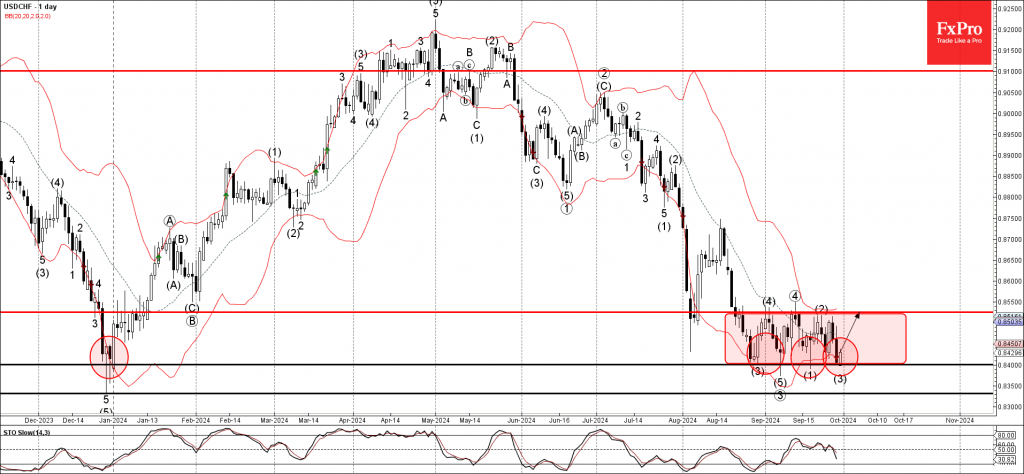
– USDCHF reversed from strong support level 0.8400

– Likely to rise to resistance level 0.8525

USDCHF currency pair recently reversed up from the strong support level 0.8400, which is the lower boundary of the sideways price range inside which the pair has been moving from the end of August.

The support level 0.8400 was further strengthened by the lower daily Bollinger Band.

Given the strength of the support level 0.8400, USDCHF currency pair can be expected to rise further to the next resistance level 0.8525 (upper boundary of the active sideways price range).

The FxPro Tech Analysis Team

The FxPro technical experts prepare a daily analysis of the most active currency pairs (majors, crosses, exotics) and commodities. Selected instruments are reviewed on daily trends (D1, H4), using the active Elliott Wave setups, Japanese candlesticks, indicators, and support/resistance levels.

Share
Published by
The FxPro Tech Analysis Team
Tags: USDCHF

Recent Posts

Tesla Wave Analysis – 10 March 2025

Tesla: ⬇️ Sell        Tesla falling inside sharp impulse waves 5 and (C) Likely to fall…

10 hours ago

Ebay Wave Analysis – 10 March 2025

Ebay: ⬇️ Sell - Ebay reversed from the resistance area - Likely to fall to…

10 hours ago

S&P 500 Wave Analysis – 10 March 2025

S&P 500: ⬇️ Sell - S&P 500 index broke support zone - Likely to fall…

11 hours ago

GBPCAD Wave Analysis – 10 March 2025

GBPCAD: ⬆️ Buy - GBPCAD rising inside minor impulse wave 3 - Likely to reach…

12 hours ago

Gold traders weighting the next move

Gold may fly to the new heights but there are risks following the stock indices.

13 hours ago

US indices desperately cling to the 200-day MA

S&P500 and Nasdaq100, dipped but found support at their 200-day MA, indicating a possible shift…

15 hours ago

This website uses cookies