Categories: Technical analysis

USDCHF Wave Analysis – 29 May 2023

• USDCHF reversed from resistance level 0.9070

• Likely to fall to support level 0.9000.

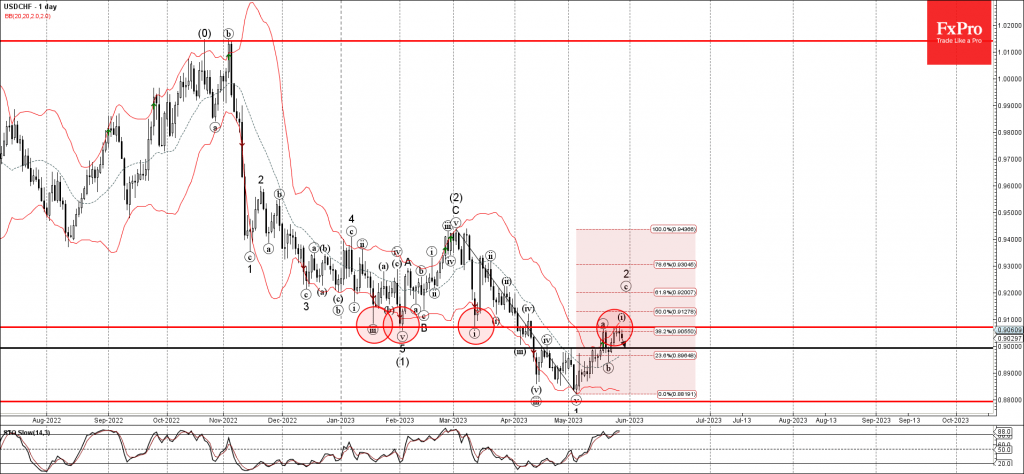
USDCHF currency pair recently reversed down from the pivotal resistance level 0.9070 (former monthly low from January, February and March).

The resistance level 0.9070 was strengthened by the upper daily Bollinger Band and by the 38.2% Fibonacci correction of the downward impulse from the start of March.

Given the overbought daily Stochastic, USDCHF can be expected to fall toward the next round support level 0.9000.

AddThis Website Tools
The FxPro Tech Analysis Team

The FxPro technical experts prepare a daily analysis of the most active currency pairs (majors, crosses, exotics) and commodities. Selected instruments are reviewed on daily trends (D1, H4), using the active Elliott Wave setups, Japanese candlesticks, indicators, and support/resistance levels.

Share
Published by
The FxPro Tech Analysis Team
Tags: USDCHF

Recent Posts

Crypto Market Testing Resistance

The crypto market has increased by over 5% and is nearing the $2.9 trillion. The…

3 hours ago

Gold Wave Analysis – 19 March 2025

Gold: ⬆️ Buy - Gold continues daily uptrend - Likely to rise to resistance level…

17 hours ago

EURJPY Wave Analysis – 19 March 2025

EURJPY: ⬇️ Sell - EURJPY reversed from resistance zone - Likely to fall to support…

17 hours ago

NZDUSD Wave Analysis – 19 March 2025

NZDUSD: ⬇️ Sell - NZDUSD reversed from the resistance level 0.5820 - Likely to fall…

1 day ago

EURUSD Wave Analysis – 19 March 2025

EURUSD: ⬇️ Sell - EURUSD reversed from resistance level 1.0930 - Likely to fall to…

1 day ago

Ethereum gives way

The crypto market remains in a downtrend, with Ethereum losing market share while Bitcoin's share…

1 day ago