Categories: Technical analysis

USDCHF Wave Analysis 29 December, 2020

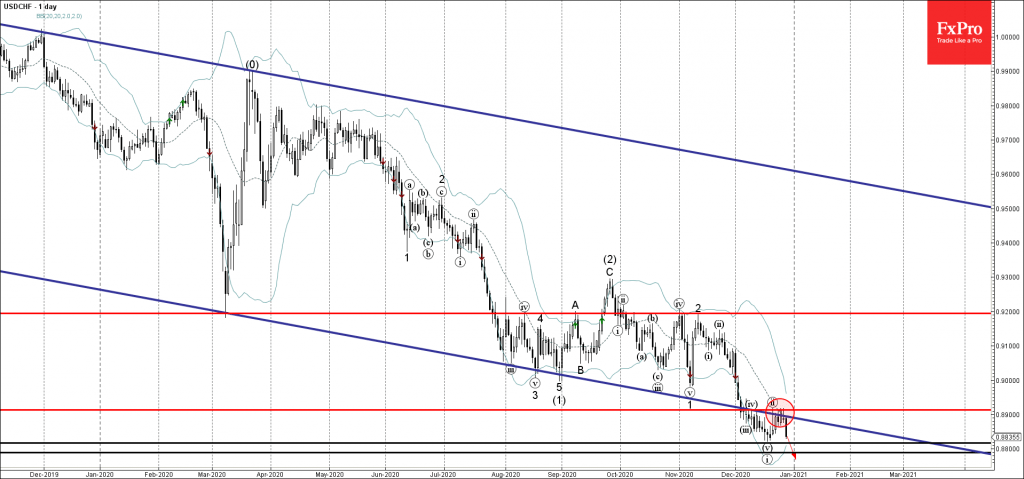
• USDCHF reversed from resistance level 0.8910

• Likely to fall to 0.8815

USDCHF recently reversed down from the key resistance level 0.8910 (which has reversed the price numerous times from the start of December as can be seen below) – strengthened by the lower trendline of the weekly down channel from 2019.

The downward reversal from the resistance level 0.8910 started the active minor impulse wave (iii) which is aligned with the powerful downtrend inside which the pair has been trading from last year.

USDCHF is expected to fall further toward the next support level 0.8815 (low of the previous impulse wave (i)) – followed by 0.8800.

The FxPro Tech Analysis Team

The FxPro technical experts prepare a daily analysis of the most active currency pairs (majors, crosses, exotics) and commodities. Selected instruments are reviewed on daily trends (D1, H4), using the active Elliott Wave setups, Japanese candlesticks, indicators, and support/resistance levels.

Share
Published by
The FxPro Tech Analysis Team
Tags: USDCHF

Recent Posts

Bitcoin Wave Analysis – 14 January 2026

Bitcoin: ⬆️ Buy - Bitcoin broke resistance area - Likely to rise to resistance level…

4 hours ago

NZDJPY Wave Analysis – 14 January 2026

NZDJPY: ⬇️ Sell - NZDJPY reversed down from the resistance area - Likely to fall…

4 hours ago

What is Leverage?

Leverage is a mechanism that lets traders control larger positions using smaller capital. By choosing…

9 hours ago

The dollar does not tolerate dissent

US GDP growth is driven not by the White House, but by AI. The Bank…

14 hours ago

The crypto market has made a breakthrough

The crypto market surges, hitting new highs, with bullish sentiment for Bitcoin and Ethereum amid…

15 hours ago

Brent Crude oil Wave Analysis – 13 January 2026

Brent Crude oil ⬆️ Buy - Brent Crude oil rising inside impulse wave c -…

1 day ago

This website uses cookies