- USDCHF reversed from support area
- Further gains are likely
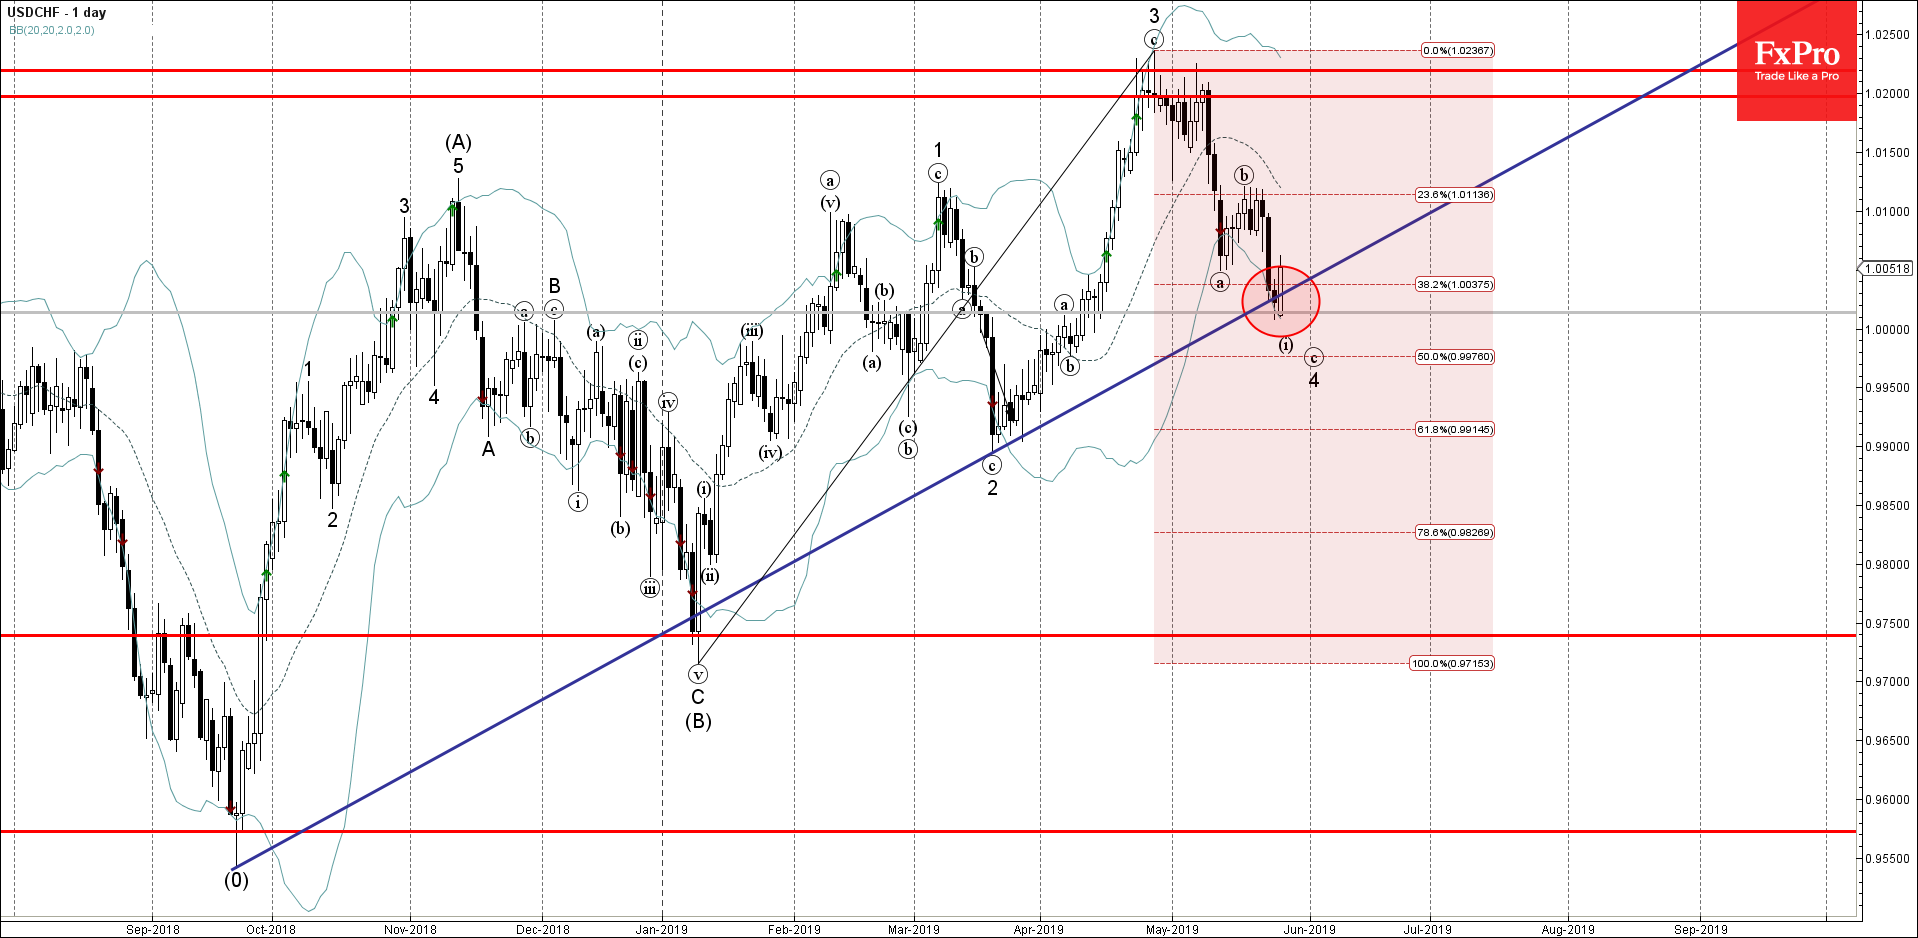
USDCHF recently reversed up from the support area lying between the parity, support trendline from September and the lower daily Bollinger Band.
This support area was further strengthened by the 38.2% Fibonacci correction of the previous upward impulse from January.
USDCHF is expected to rise further and retest the next resistance level 1.01000 (top of the previous correction (b)).